BIOSTUDIO - CELL CHAT APPLICATION 
Cell signaling is a highly complex network at both intercellular and intracellular levels, playing a pivotal role in understanding various cellular processes like cell cycle activation, programmed cell death, migration, and differentiation. Single-cell and spatial RNA-sequencing data encodes gene expression information that can be leveraged to deduce these intercellular communications.
The Cell Chat application integrates comprehensive analysis, scientific visualization, and streamlines workflows for inferring cell-cell communications for scRNA-seq data. Powered by BioStudio, Cell Chat application is specifically designed for biologists featuring an interactive user interface and efficient data organization. It also enhances analysis transparency and reproducibility through code availability and history management.
1. ALGORITHM INTRODUCTION 
The CellChat algorithm, implemented in the open-source R package, empowers users to decipher and analyze intercellular communications within single-cell RNA sequencing (scRNA-seq) datasets.
The algorithm seamlessly integrates manual curation of a comprehensive signaling molecule interaction database, accounting for diverse structural compositions of ligand-receptor interactions. This includes considerations for multimeric ligand-receptor complexes, soluble agonists and antagonists, as well as stimulatory and inhibitory membrane-bound co-receptors.
To infer cell-state-specific signaling communications, CellChat employs mass action models, complemented by differential expression analysis and statistical tests applied to discrete or continuous cell states along pseudotime cell trajectories. The algorithm offers a suite of visualization outputs, facilitating intuitive interpretation by users. Additionally, CellChat enables quantitative characterization and comparison of inferred intercellular communications through social network analysis tools, pattern recognition methods, and manifold learning approaches.
To delve into a more detailed understanding of the CellChat algorithm and its investigative potential, access the full paper.
In the CellChat application, we have integrated the core algorithm from the CellChat package while making strategic modifications to the output format. This adaptation enables the application to establish a connection with the client site through the RESTful API protocol, facilitating efficient and user-friendly interaction with the algorithm’s results.
2. FILE SUBMISSION 
After launching the application, the first interface provides information on workflow, example datasets and recent files library, and file submission.
The CellChat workflow comprises three steps:
1. Input File: Currently, we support two formats, .h5ad and Seurat, for single-cell and spatial RNA sequencing data. The application will estimate what is the maximum file size you can upload based on your computer’s power. Users can submit datasets for both human and mouse.
2. Set up Parameters and Run CellChat: After file submission, users can choose cells and set parameters for subsequent analyses.
3. Post-Analysis: This step involves visualizing and adjusting various analysis results, including cell-cell interaction, pathway analysis, and pattern analysis.

With the file submission, there are two options provided here:
- To start with the example dataset prepared by BioTuring: Click on any dataset listed under
"Examples"or access the"Example library"by:
-
Clicking
"Add new file" -
Switching to
"Example library"
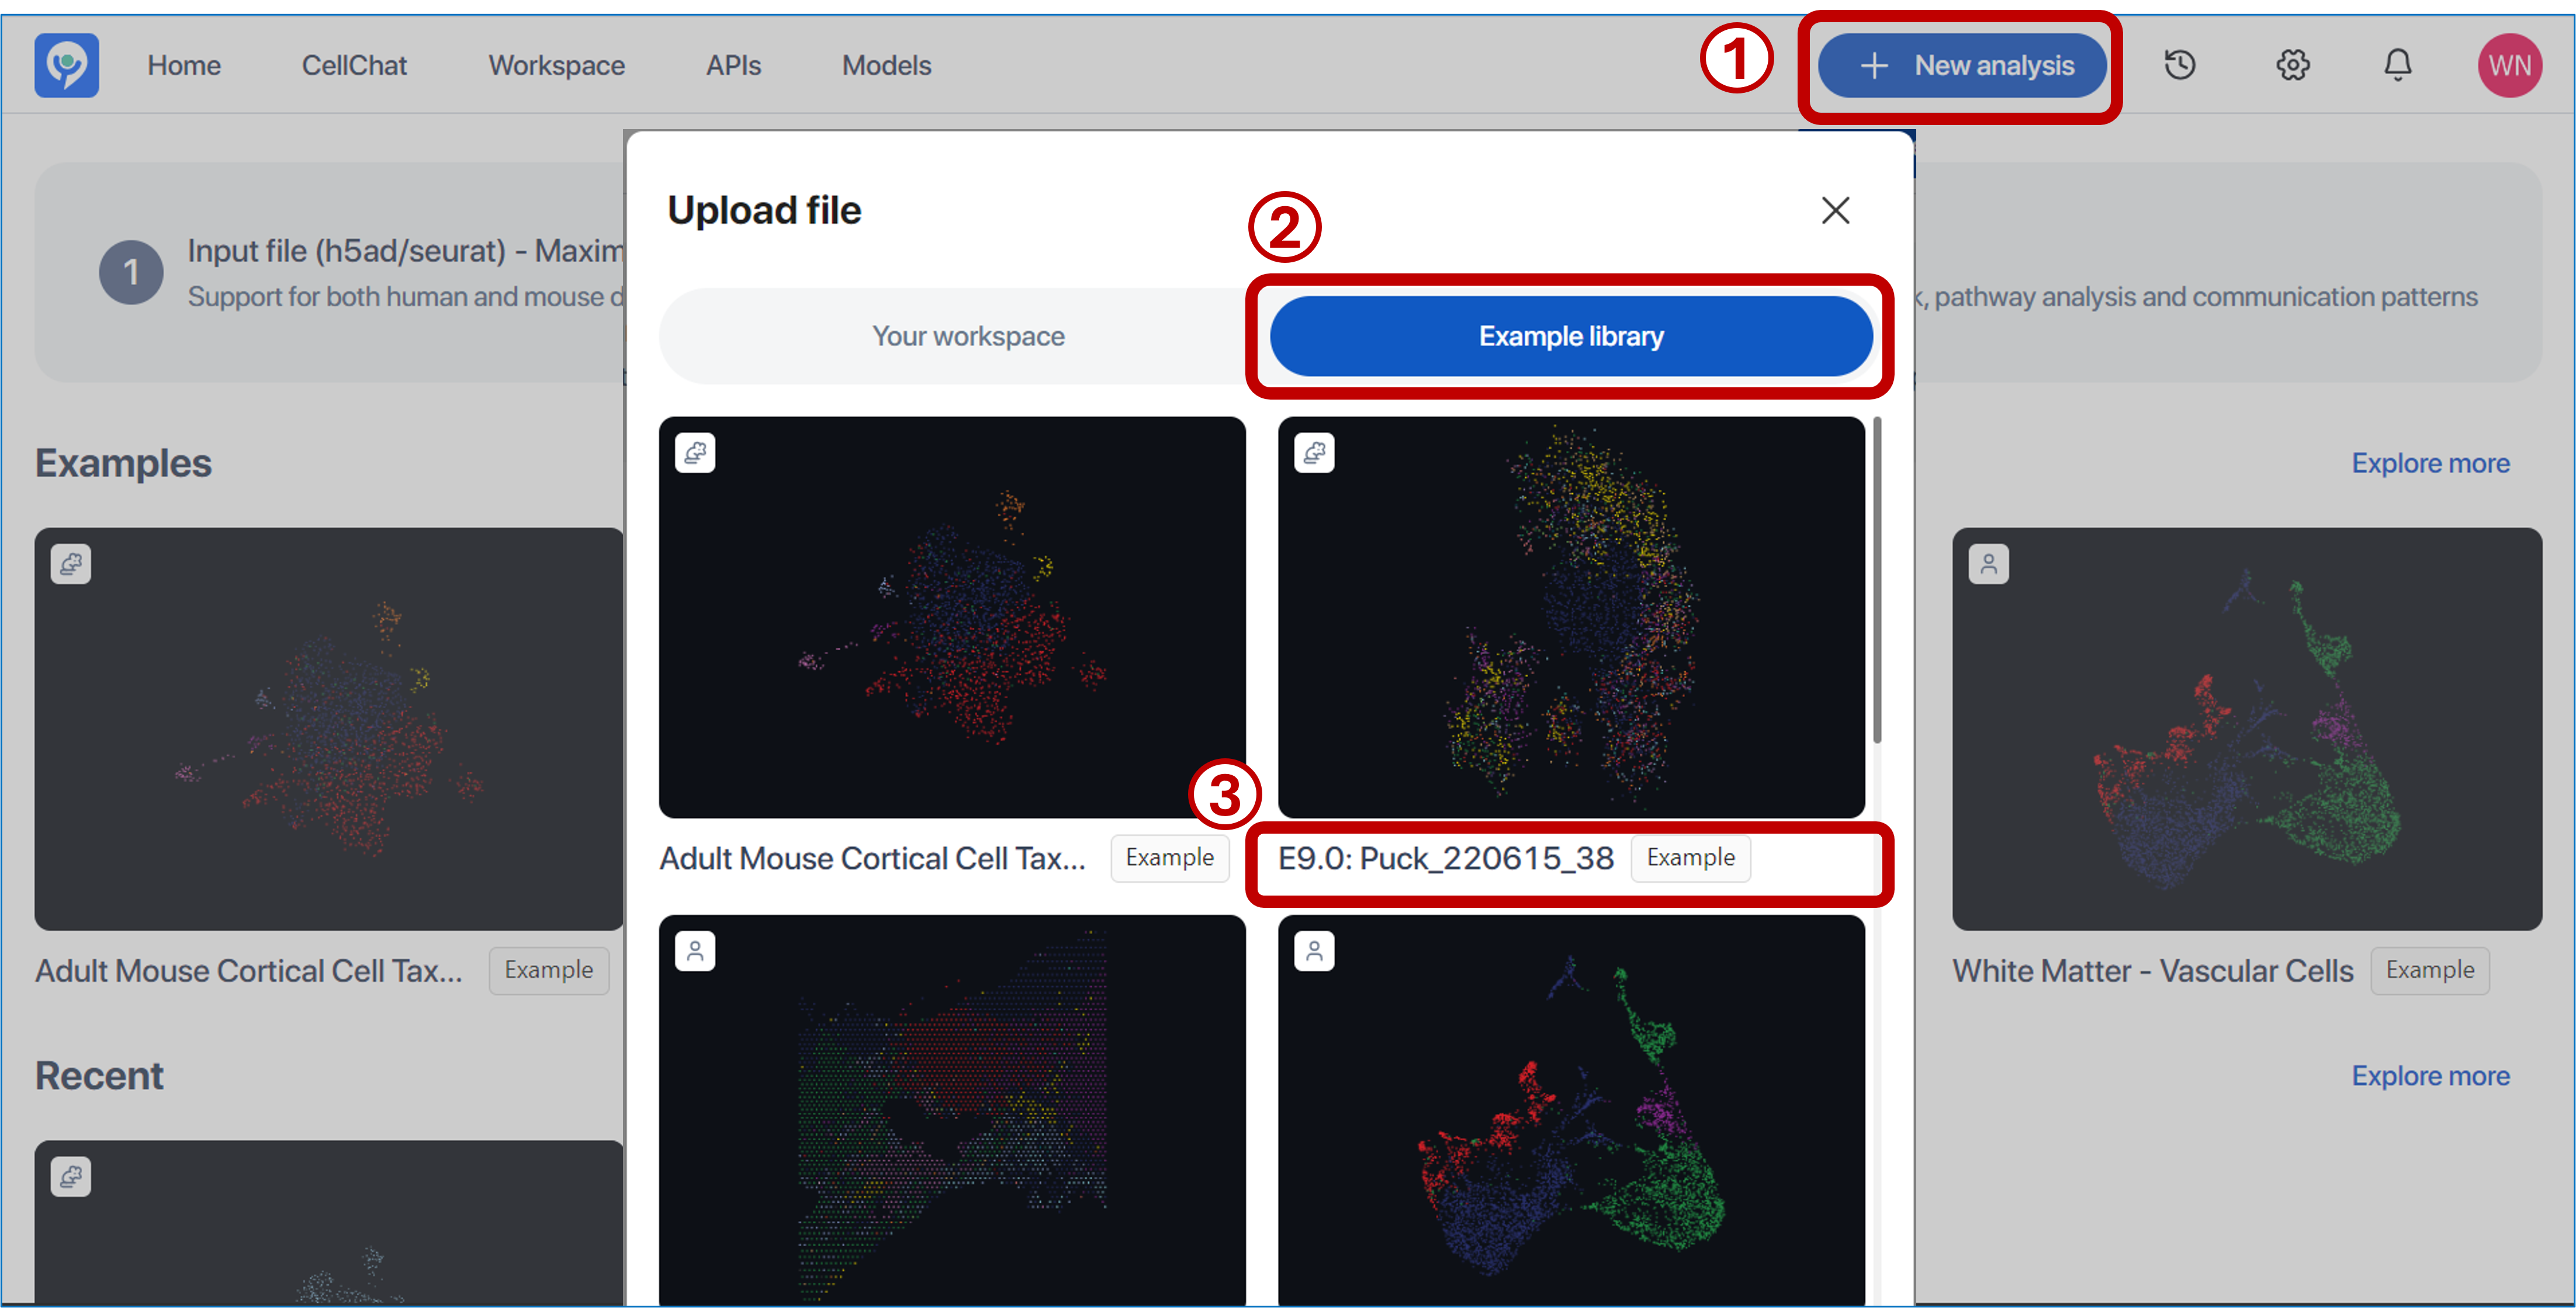
- Selecting the example dataset you want to run.
-
To work with your files: Click
"Add new file"to open the upload file panel, where your workspace folders and files are listed for selection.Before this step, upload your file to the working space. For more details, visit the document https://studio.bioturing.com/document/working-with-file.
-
Clicking
“Add new file” -
Switching to
“Your workspace” -
Searching for the folder where the file is located
-
Or connecting with the cloud storages. For further information, visit the document via this link https://studio.bioturing.com/document/working-with-file#cloud-storage. After connecting with your cloud storage, click the
"Refresh"button to reload your workspace. -
Selecting the file (.h5ad or Seurat format)
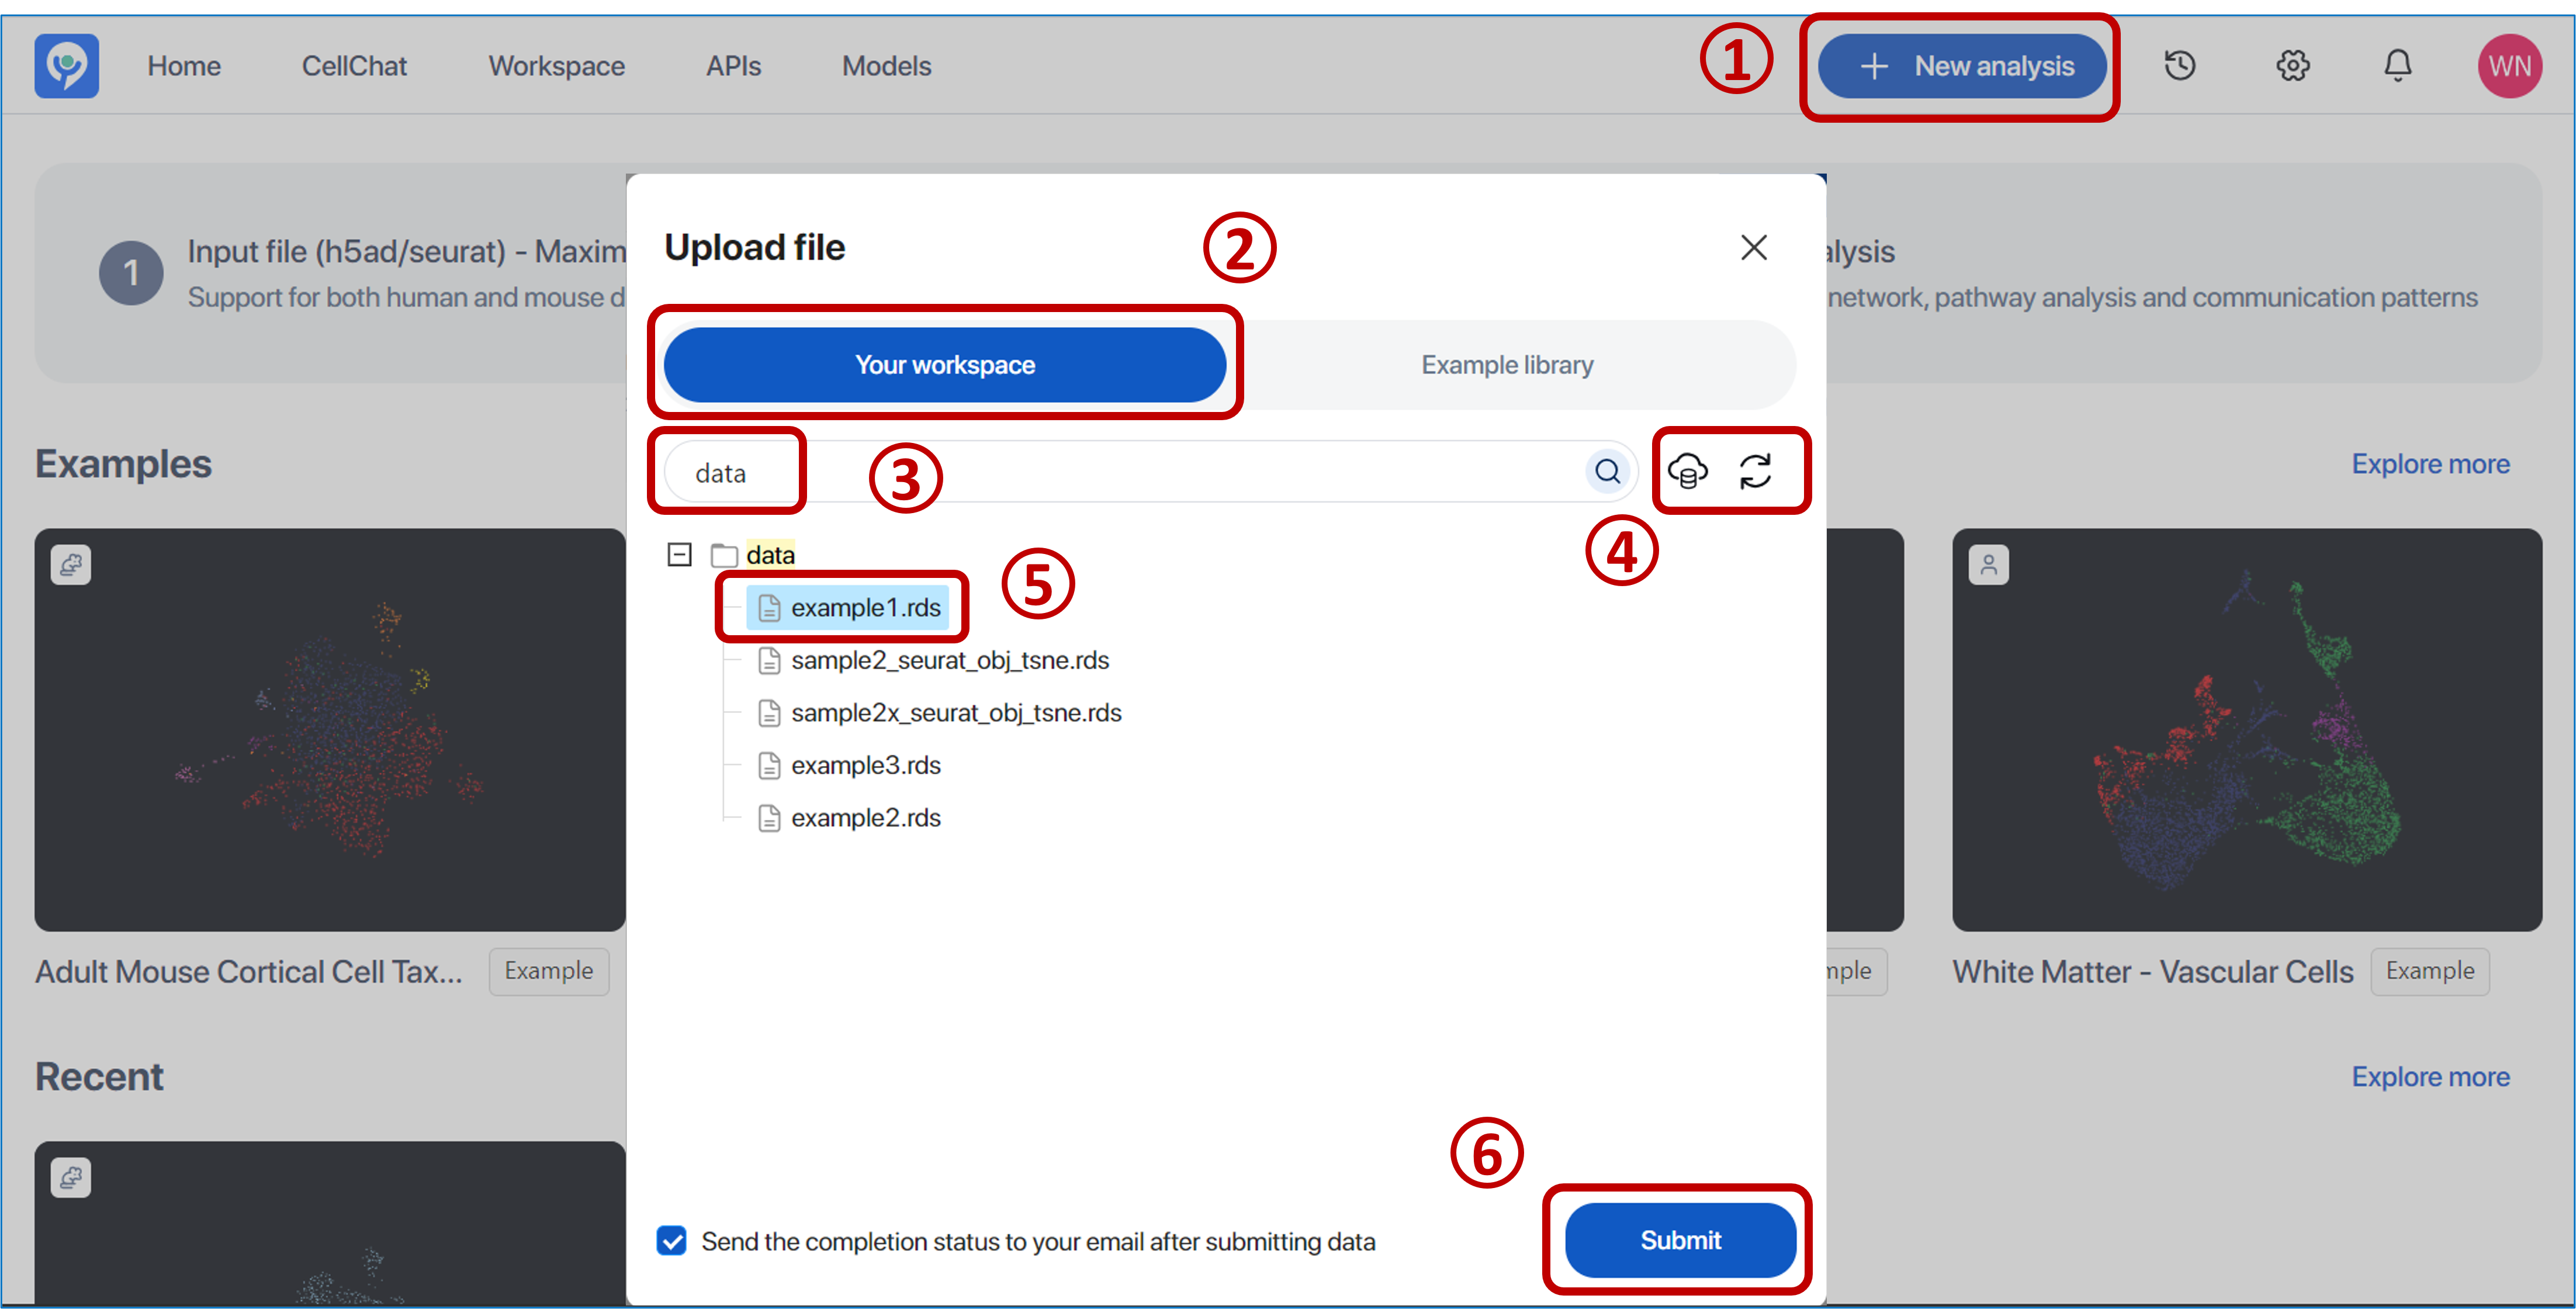
- Clicking
“Submit”to start the submission process
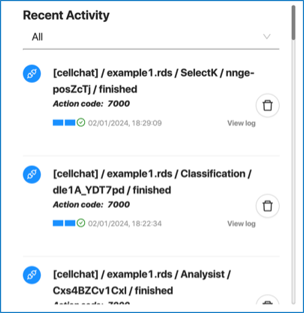
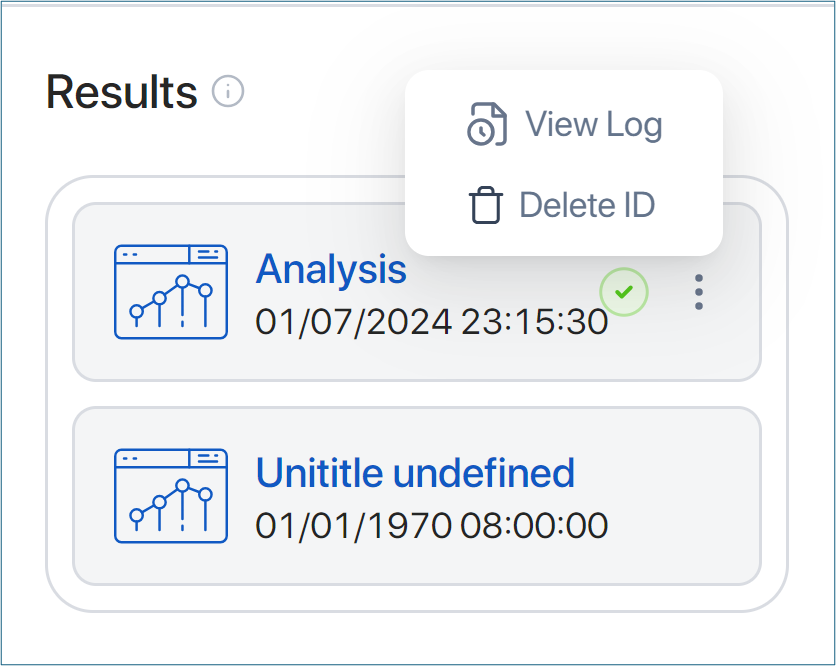
The “Recent” zone will list examples or datasets that have been submitted. Next to each dataset name, hovering over it will provide you with the options to:
- View log
- Edit history name
- Delete history
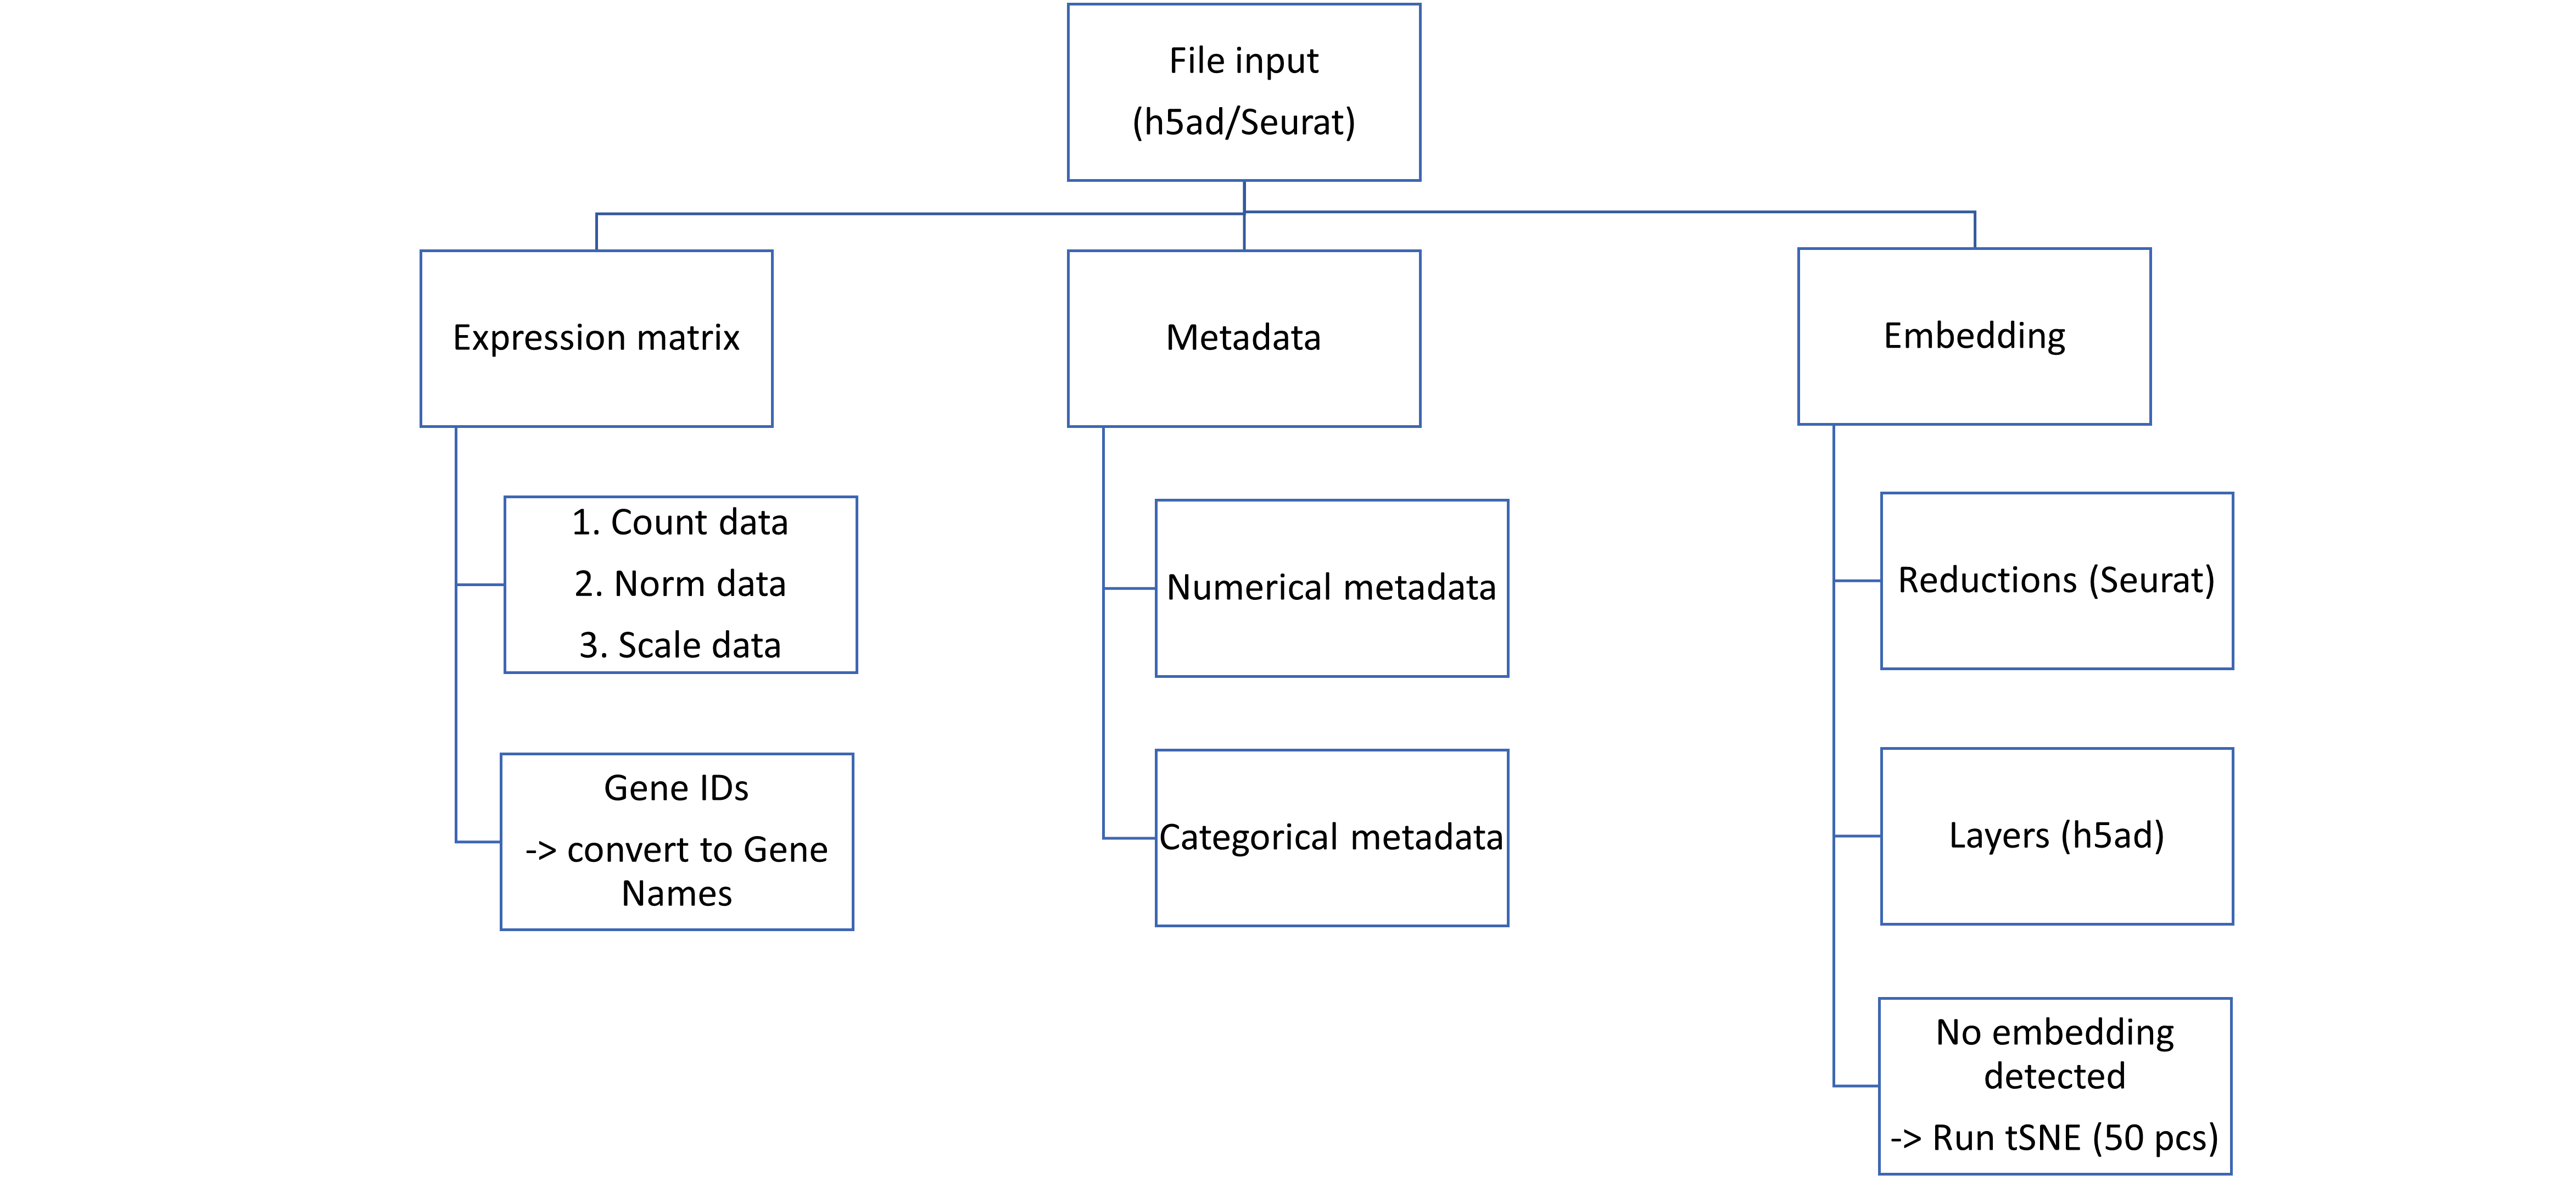
The application reads and processes various slots from the submitted file, following the flow outlined below:
-
Expression Matrix:
- The application requires the gene expression profile data of cells, preferably count data. If count data is not provided, norm data and scale data will be selected.
- CellChat requires Gene Names for further processing; if Gene IDs are provided, a conversion step will occur.
-
Metadata:
The application processes information from two types of metadata:
- Numerical metadata
- Categorical metadata: Metadata that includes a label with only one cell, and the number of labels is equal to the number of cells, will be removed.
-
Embedding:
- The application extracts information from reductions (from Seurat file) and layers (from h5ad file) for embedding.
- If embedding information is not provided, the default tSNE with 50 principal components will be run.
3. INITIATING ANALYSIS INTERFACE 
After the submission process, the initiating analysis interface will include four panels:
- Management and shortcuts corner
- Selecting cells panel
- Scatter plot
- Setting up parameters and running CellChat

In Management and shortcuts corner, the user can:
- Access to shortcuts: Home page, CellChat initial page, Workspace, APIs, and Models.
- Create a new analysis within the current tab or open a new tab by clicking on
“New analysis”. - View and launch previous data by clicking on the clock icon.
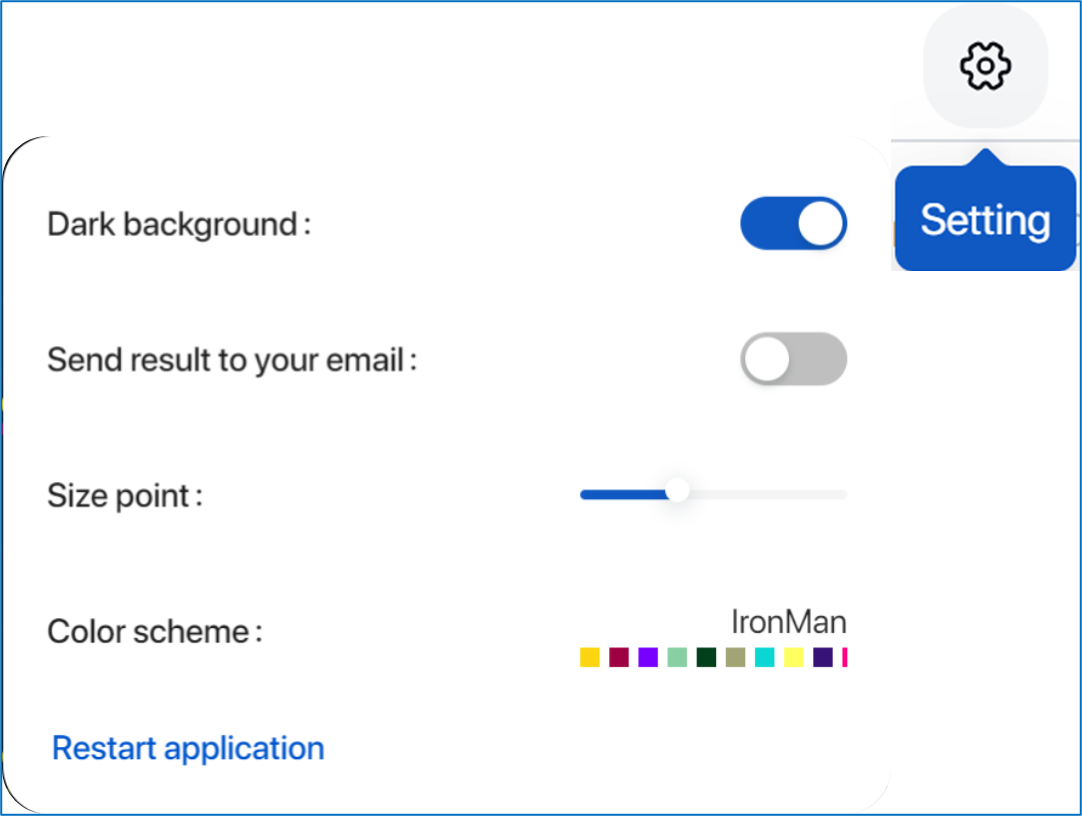
- Set up background mode, email task notifications, size point, color scheme, or reset application by clicking on the gear icon.

- Check activity notifications and progress by clicking on the bell icon.
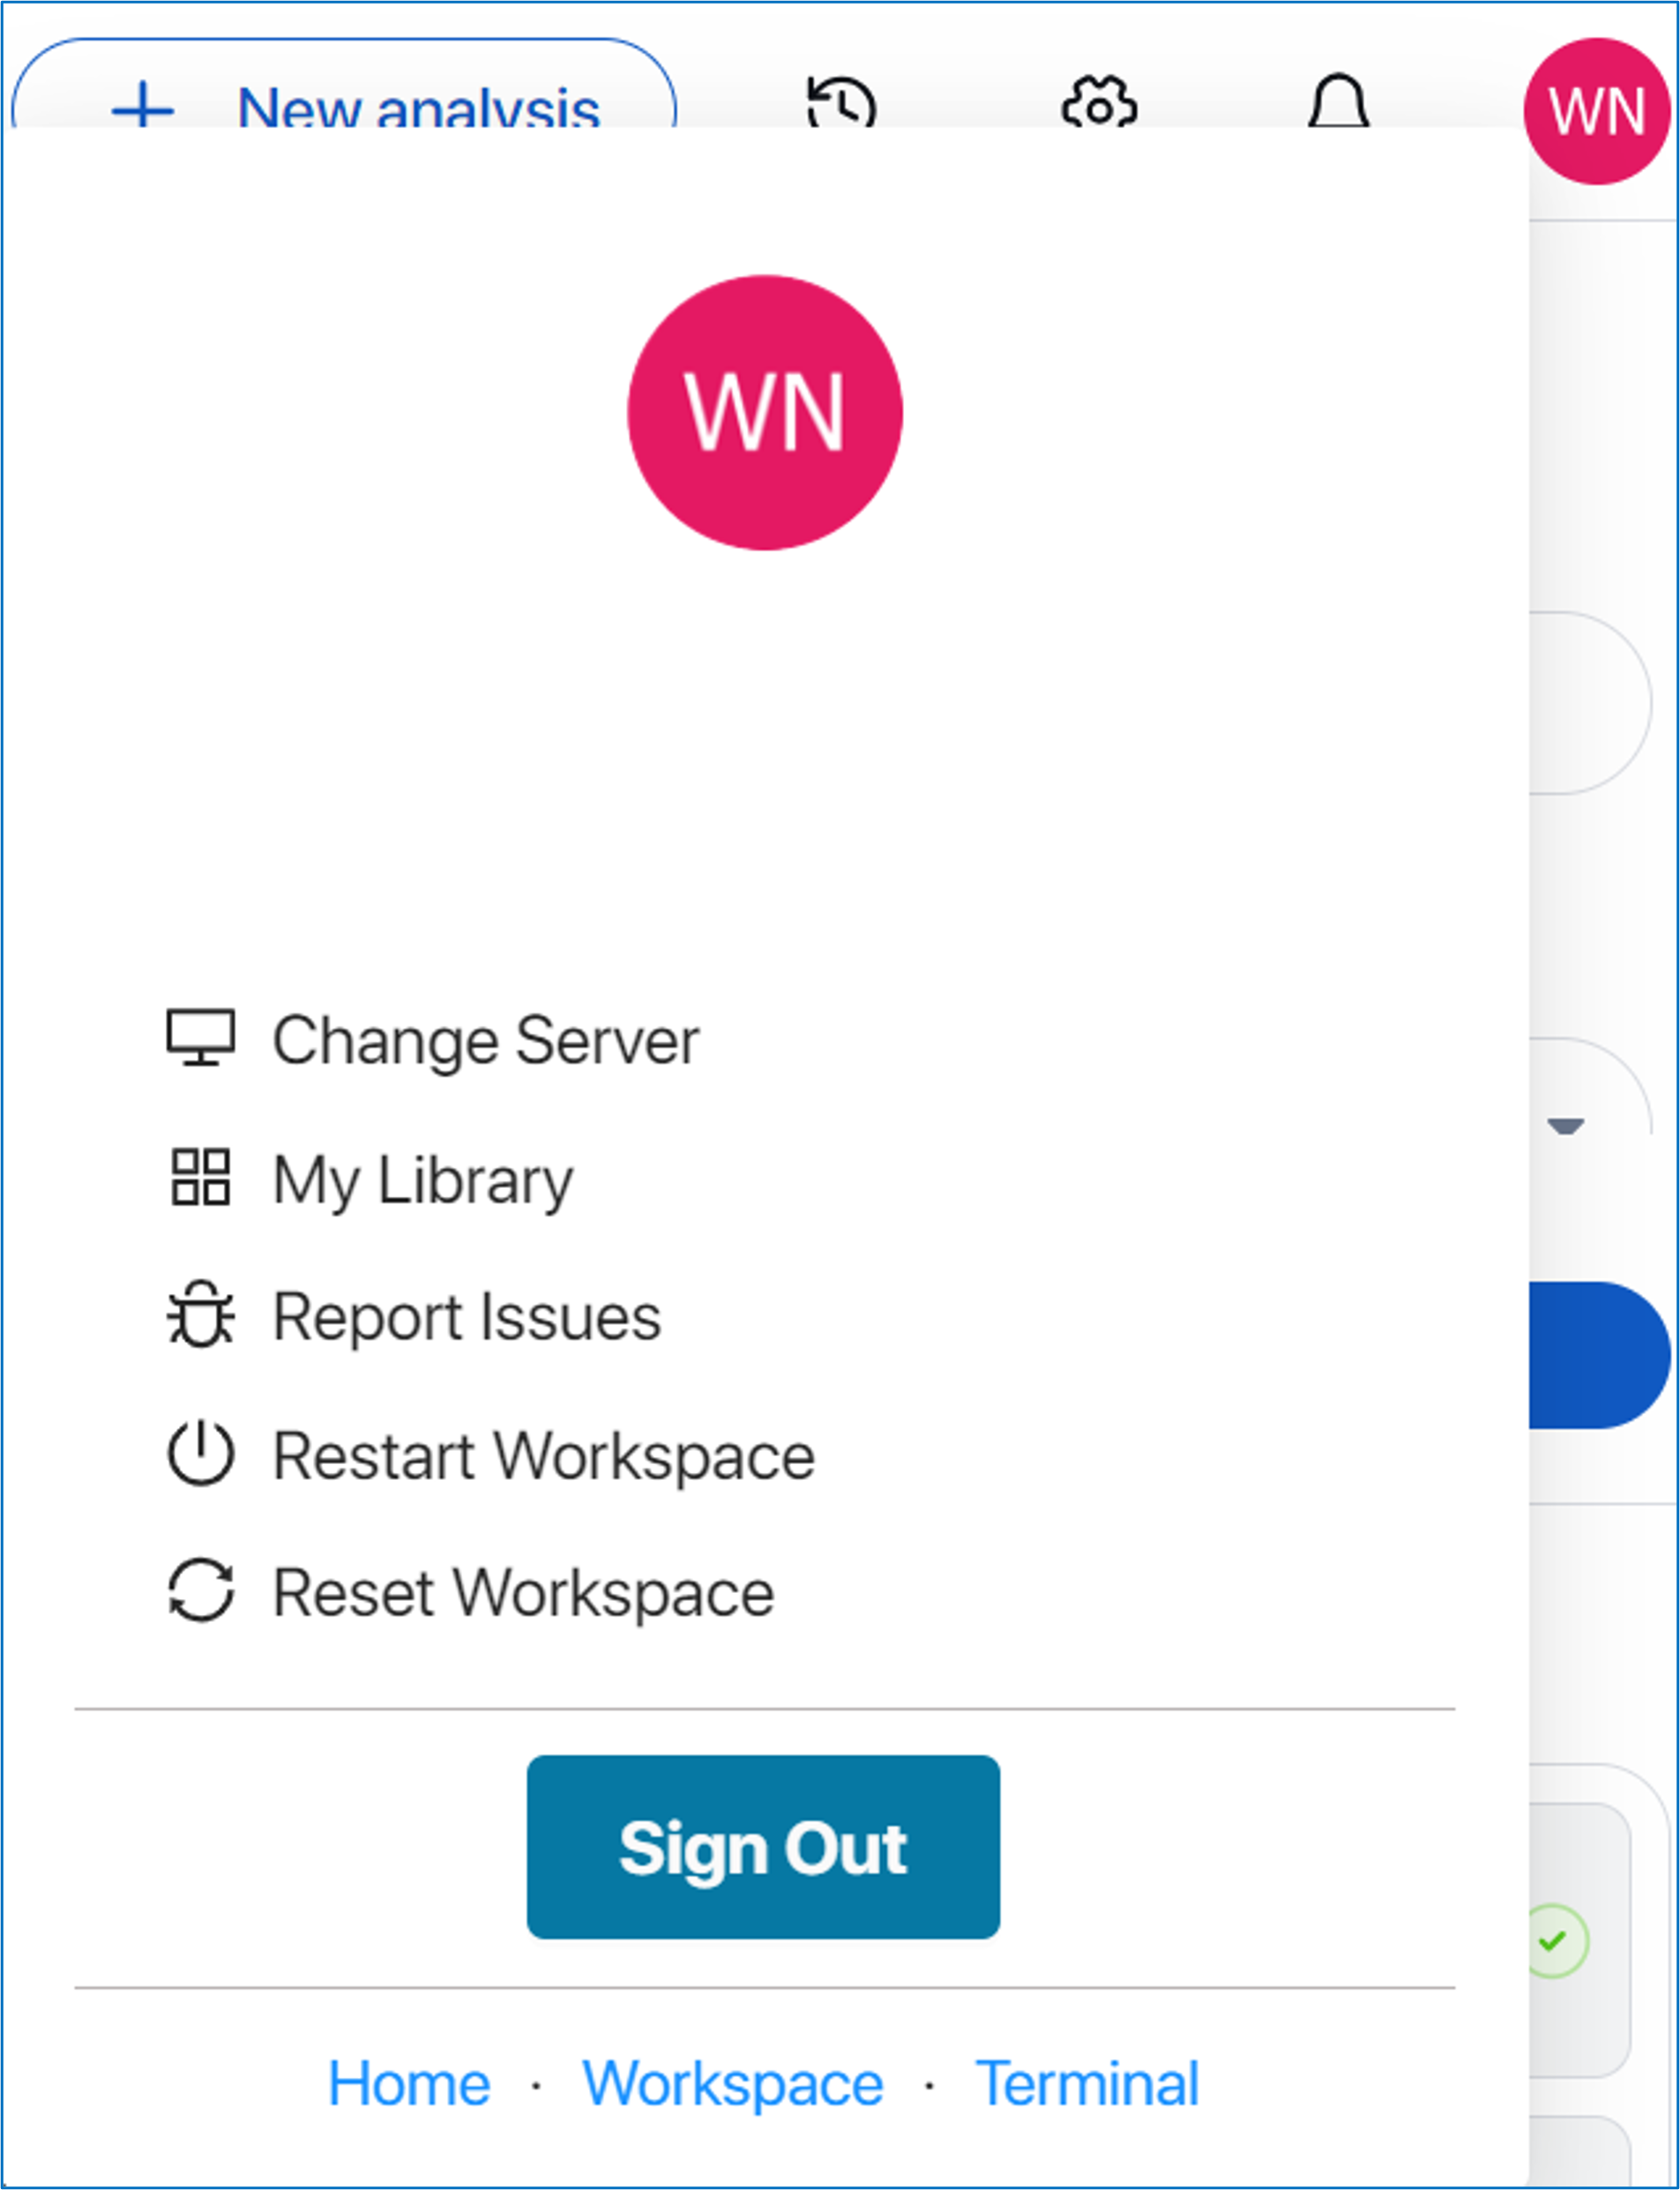
- Access server support, your library, report issues, restart/reset workspace, and account management by clicking on your account avatar
For Selecting cells panel and Scatter plot, please prefer to Section 4. SELECTING CELLS.
For Setting up parameters and running CellChat, please refer to Section 5. SETTING UP PARAMETERS AND RUN CELLCHAT.
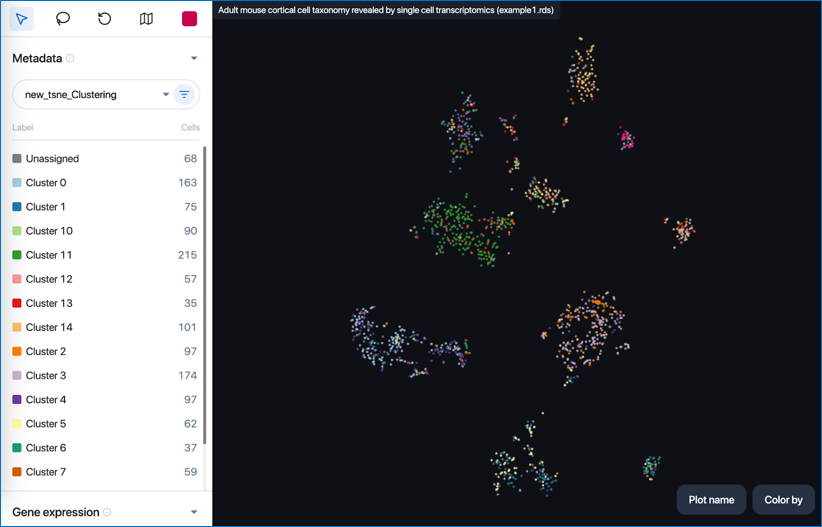
4. SELECTING CELLS 
The Selecting cells panel and Scatter plot will provide the tools to select specific groups of cells for running CellChat.
Selecting cells by lasso in scatter plot 
At the top of the ‘Selecting Cells’ panel, various options are available to interact with the scatter plot:
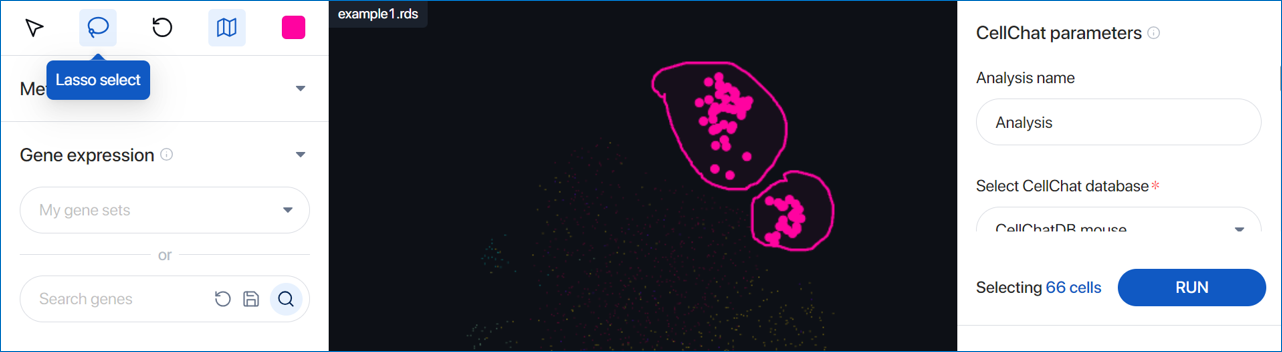
- View: Back to view mode for dragging and dropping around the scatter plot
- Lasso select: Draw closed paths on the scatter plot. Cells within the path are selected and displayed as larger dots.
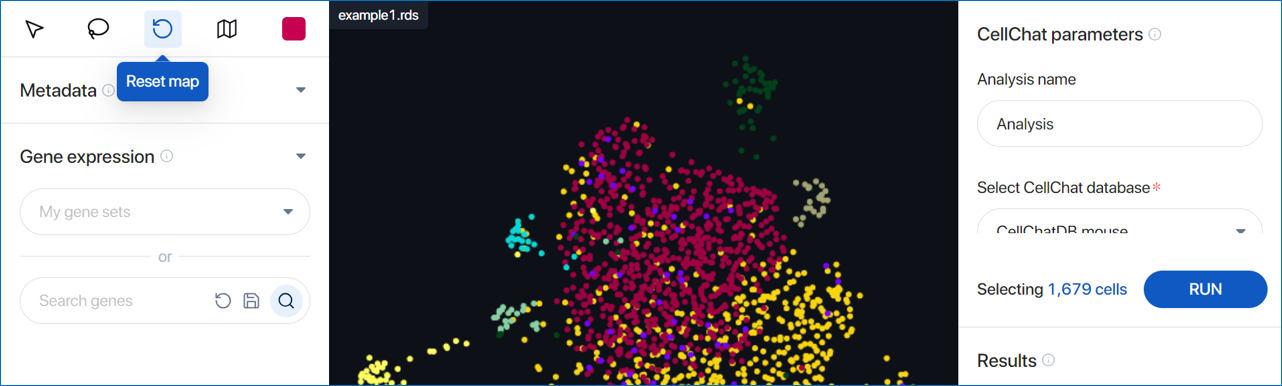
- Reset map: Reset the zoom level and plot position to the default setting. The selected cells are also cleared.
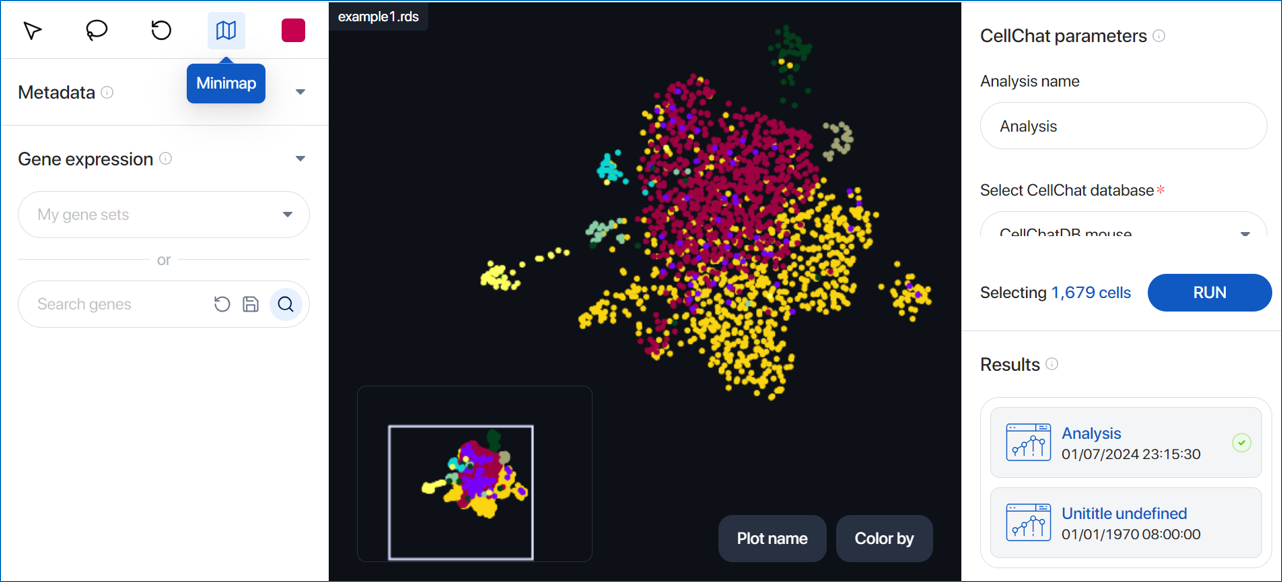
- Minimap: Enable the minimap positioned at the bottom-left corner of the scatter plot, offering a global view.
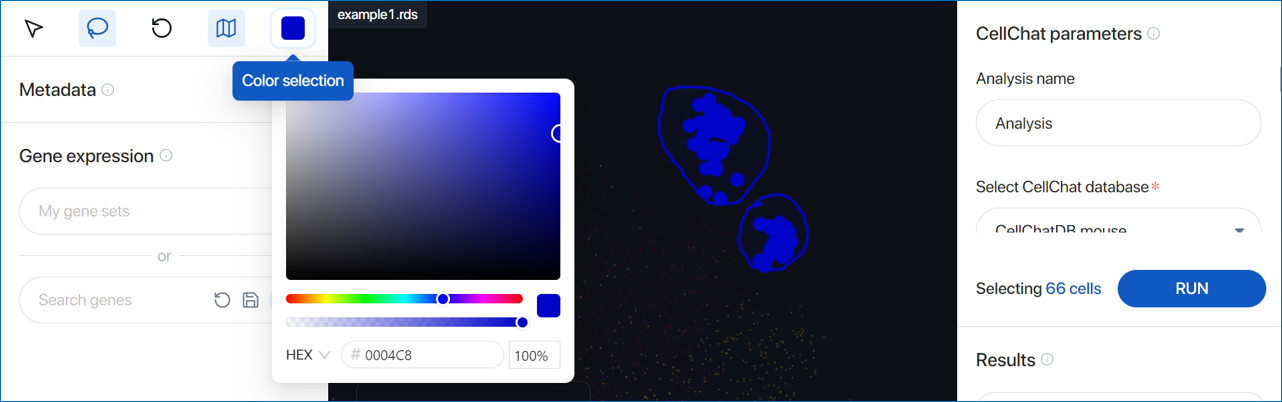
- Color selection: Change the color used to highlight the lasso-selected cells.
Selecting cells by by metadata 
The second method involves selecting cells based on metadata information. The top panel provides the following capabilities:
- Show/Hide Metadata panel
- Open Advanced clusters/cell types filter
- Show the metadata list
There are two options to select cells using metadata:
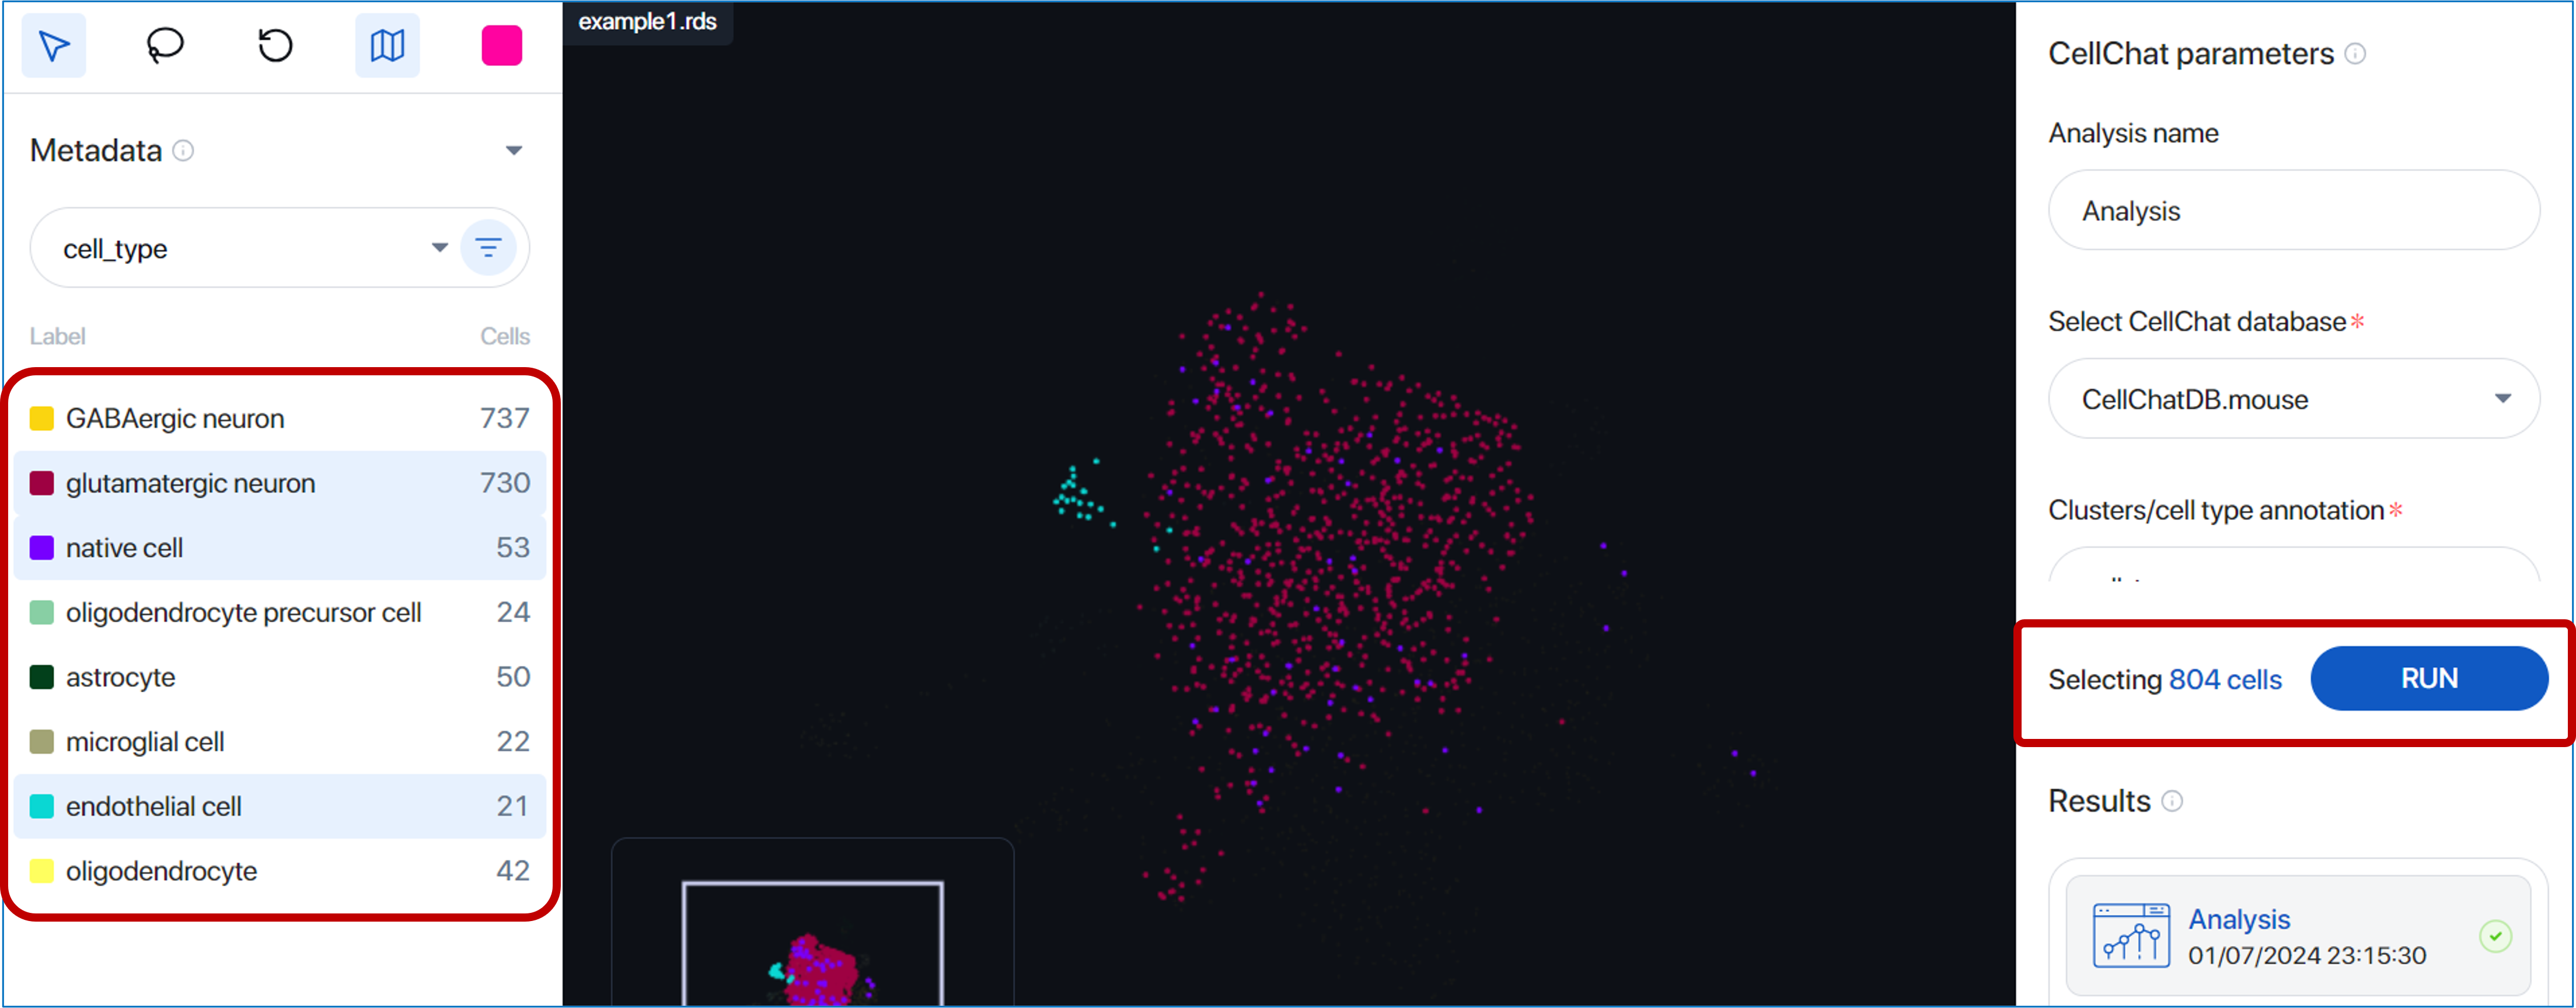
- Directly click on one or multiple metadata groups under a metadata field. The selected cells will be displayed in the scatter plot with corresponding colors matched to the group-colored label.

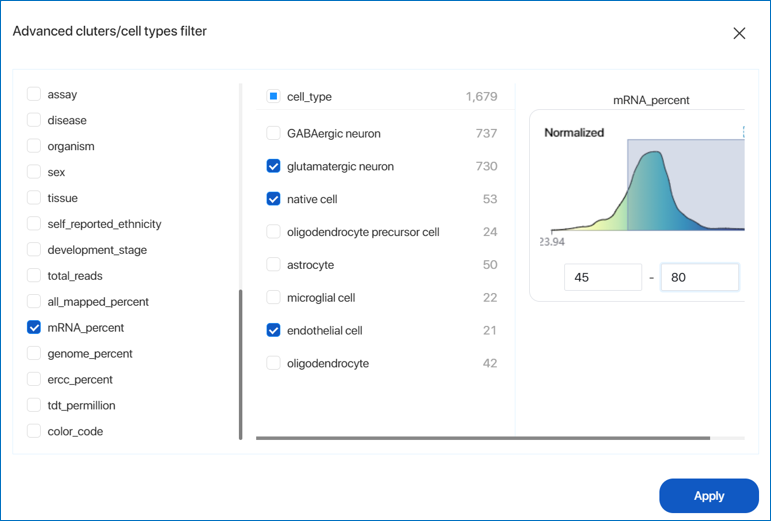
- Use the Advanced clusters/cell types filter. You can combine different groups from various metadata fields to filter the cells. An example is illustrated below: GABAergic neuron and glutamatergic neuron cell types with mRNA_percent ranging from 23.94 to 82.56 are filtered and selected. After defining the parameters, simply click
'Apply'.
Selecting cells by gene expression 
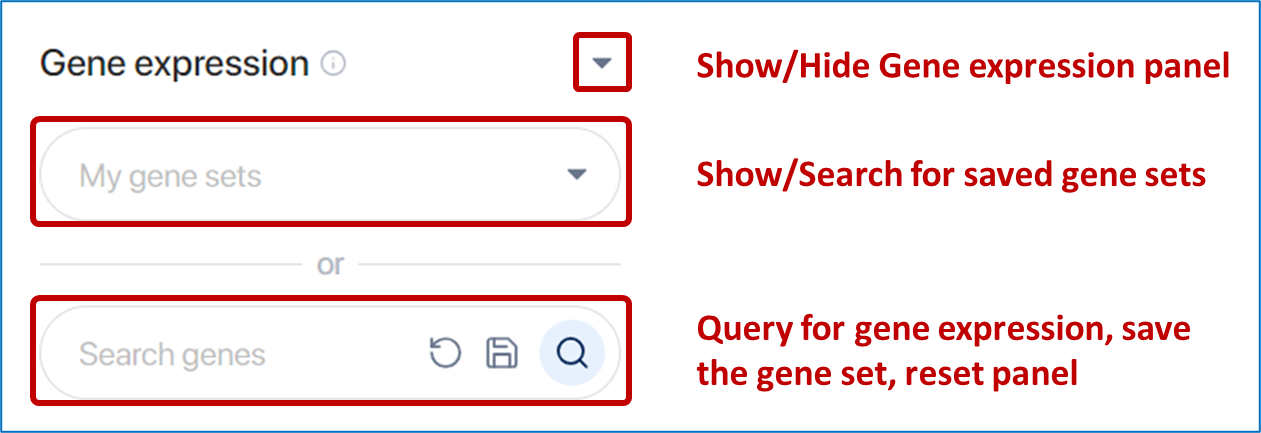
The third method involves selecting cells based on gene expression. The panel provides the following capabilities:
- Show/Hide Gene expression panel
- Show/Search for saved gene sets
- Query gene expression, reset panel, and save gene set
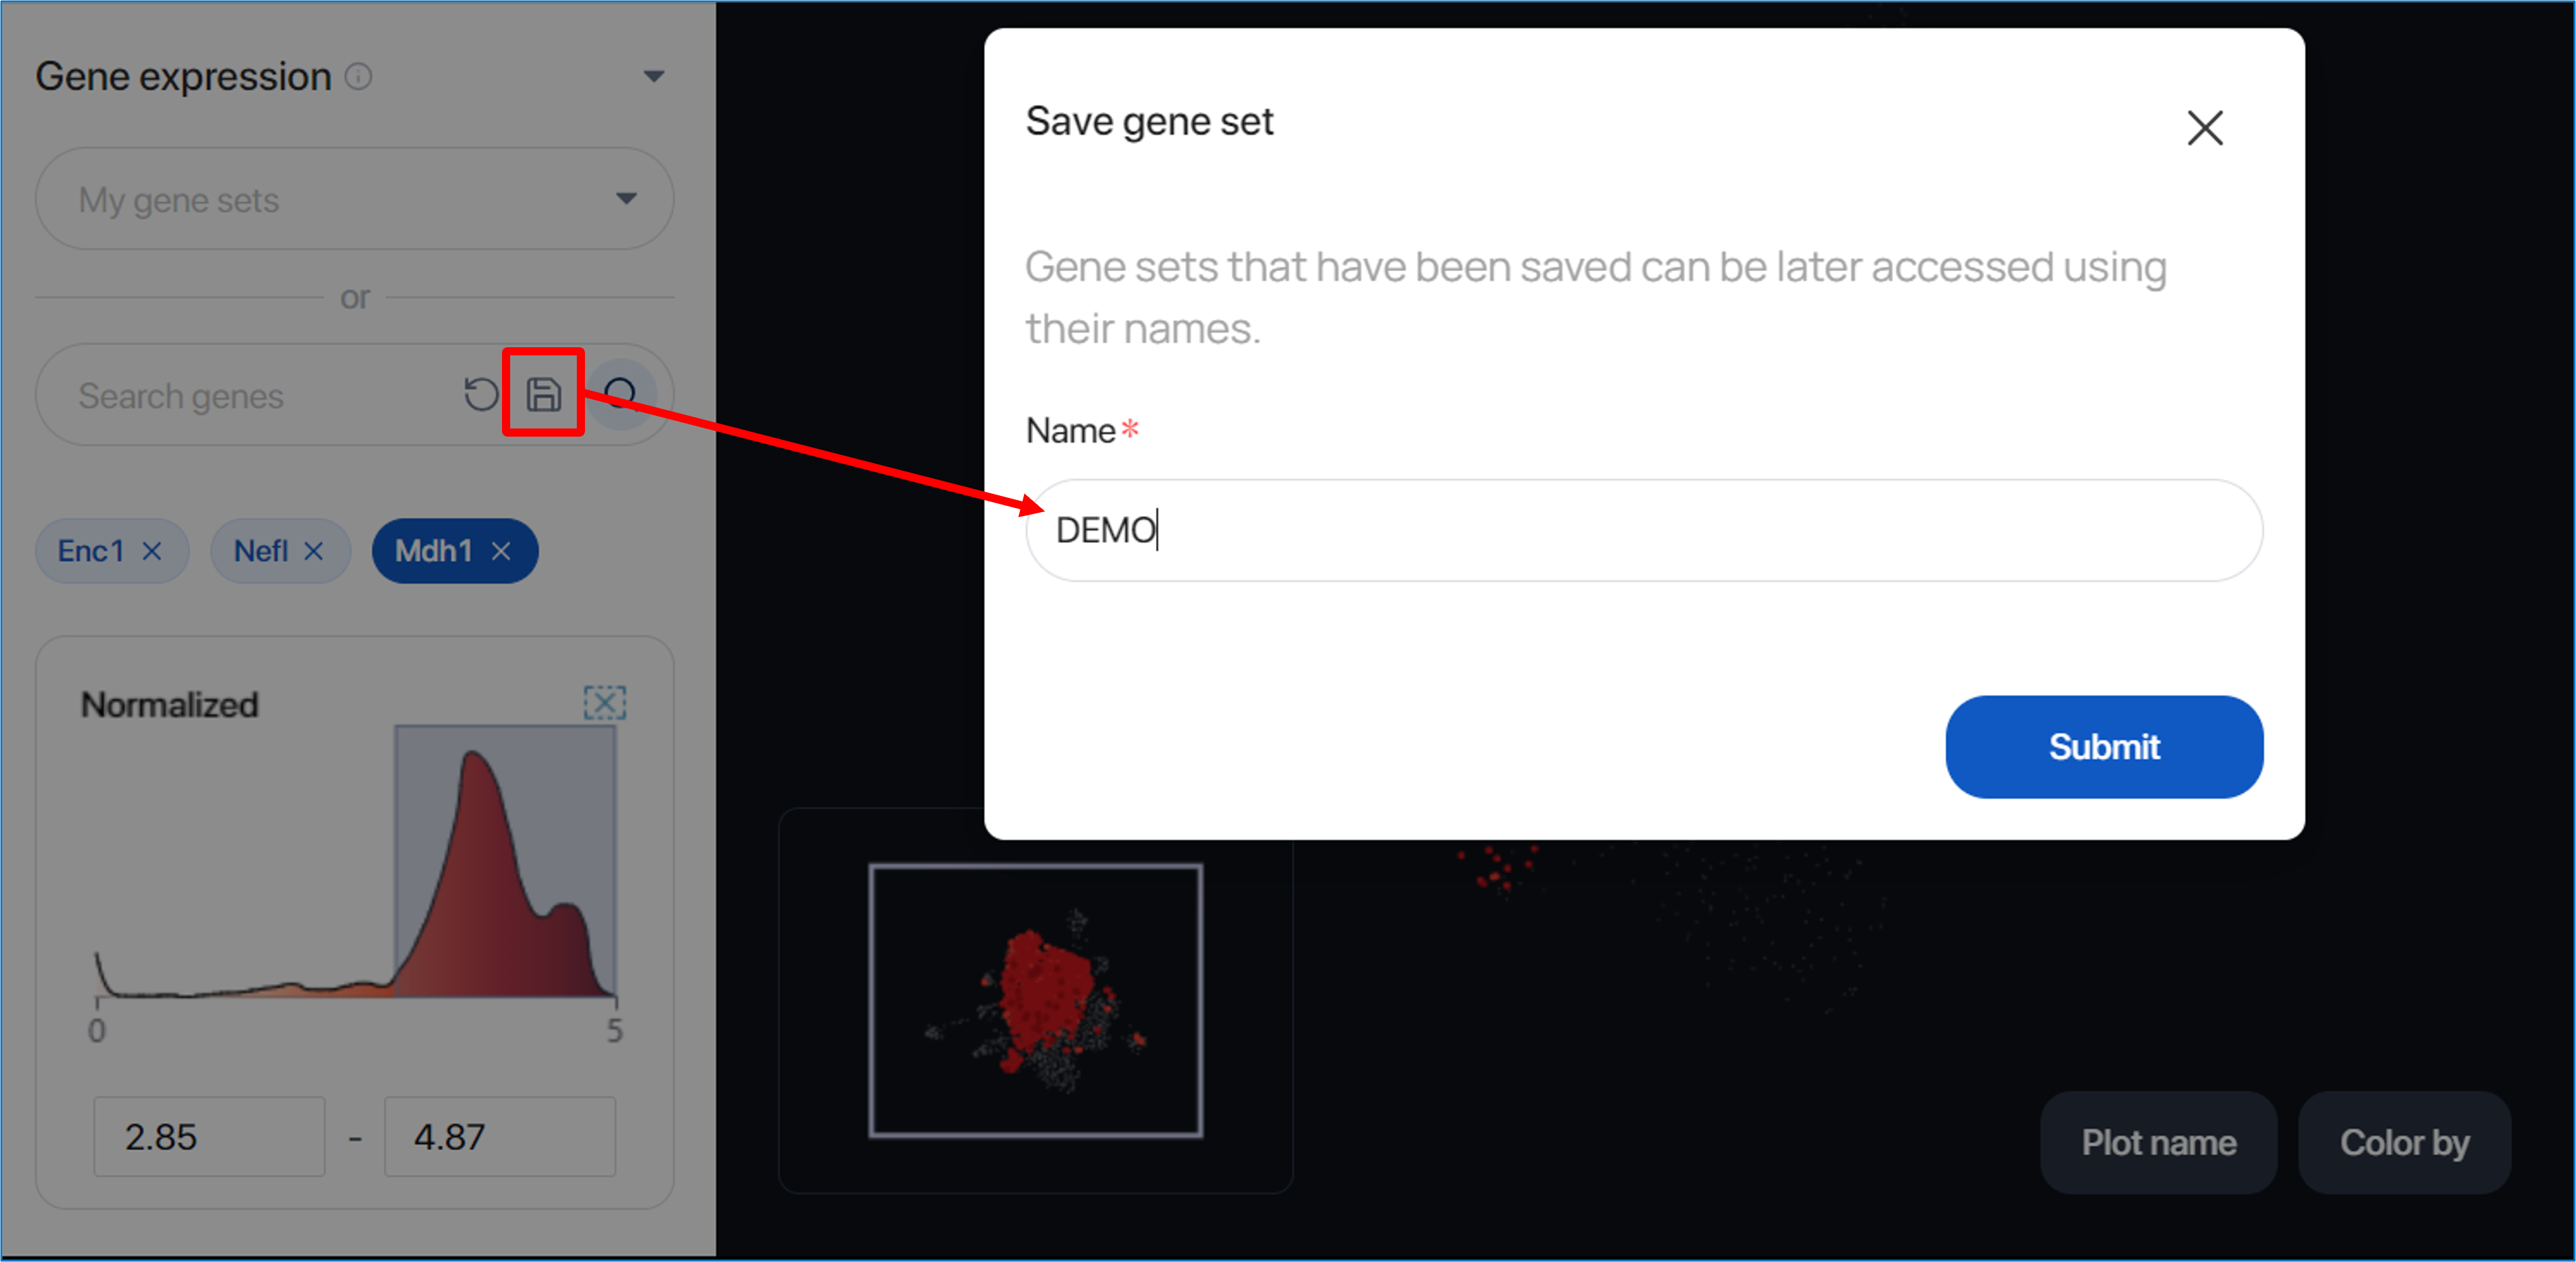
When you input gene names into the 'Search genes' panel and click the search button, users can visualize the gene expression in the scatter plot and select cells based on specific expression values by dragging and dropping in the plot or inputting a range into the box. The selected cells will be highlighted in the scatter plot. To visualize other genes from the input list, click on the gene name.

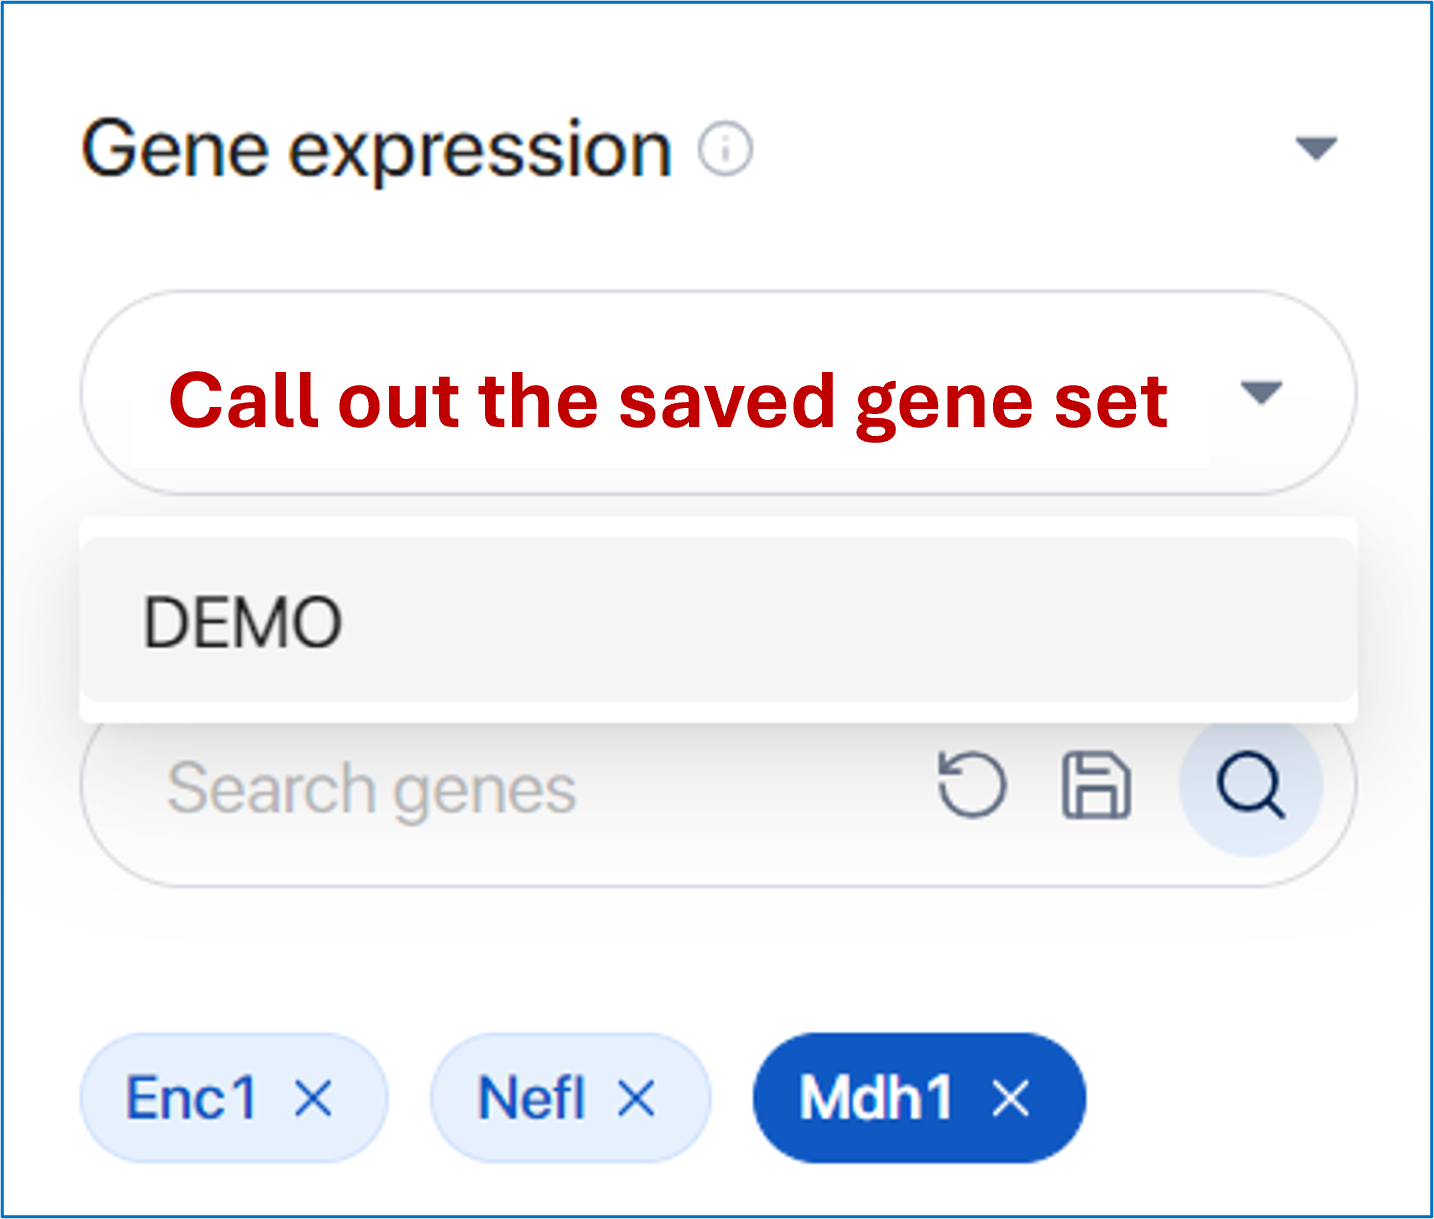
To save the gene sets for further use, you can click on the save button, input the gene set name, and then click ‘Submit’ to save the information.
In the future, you can easily access the saved gene set and utilize it for analysis.
The number of selected cells is displayed in the CellChat parameters panel. If there is no selecting action, by default, all the cells from the dataset will be selected for running.
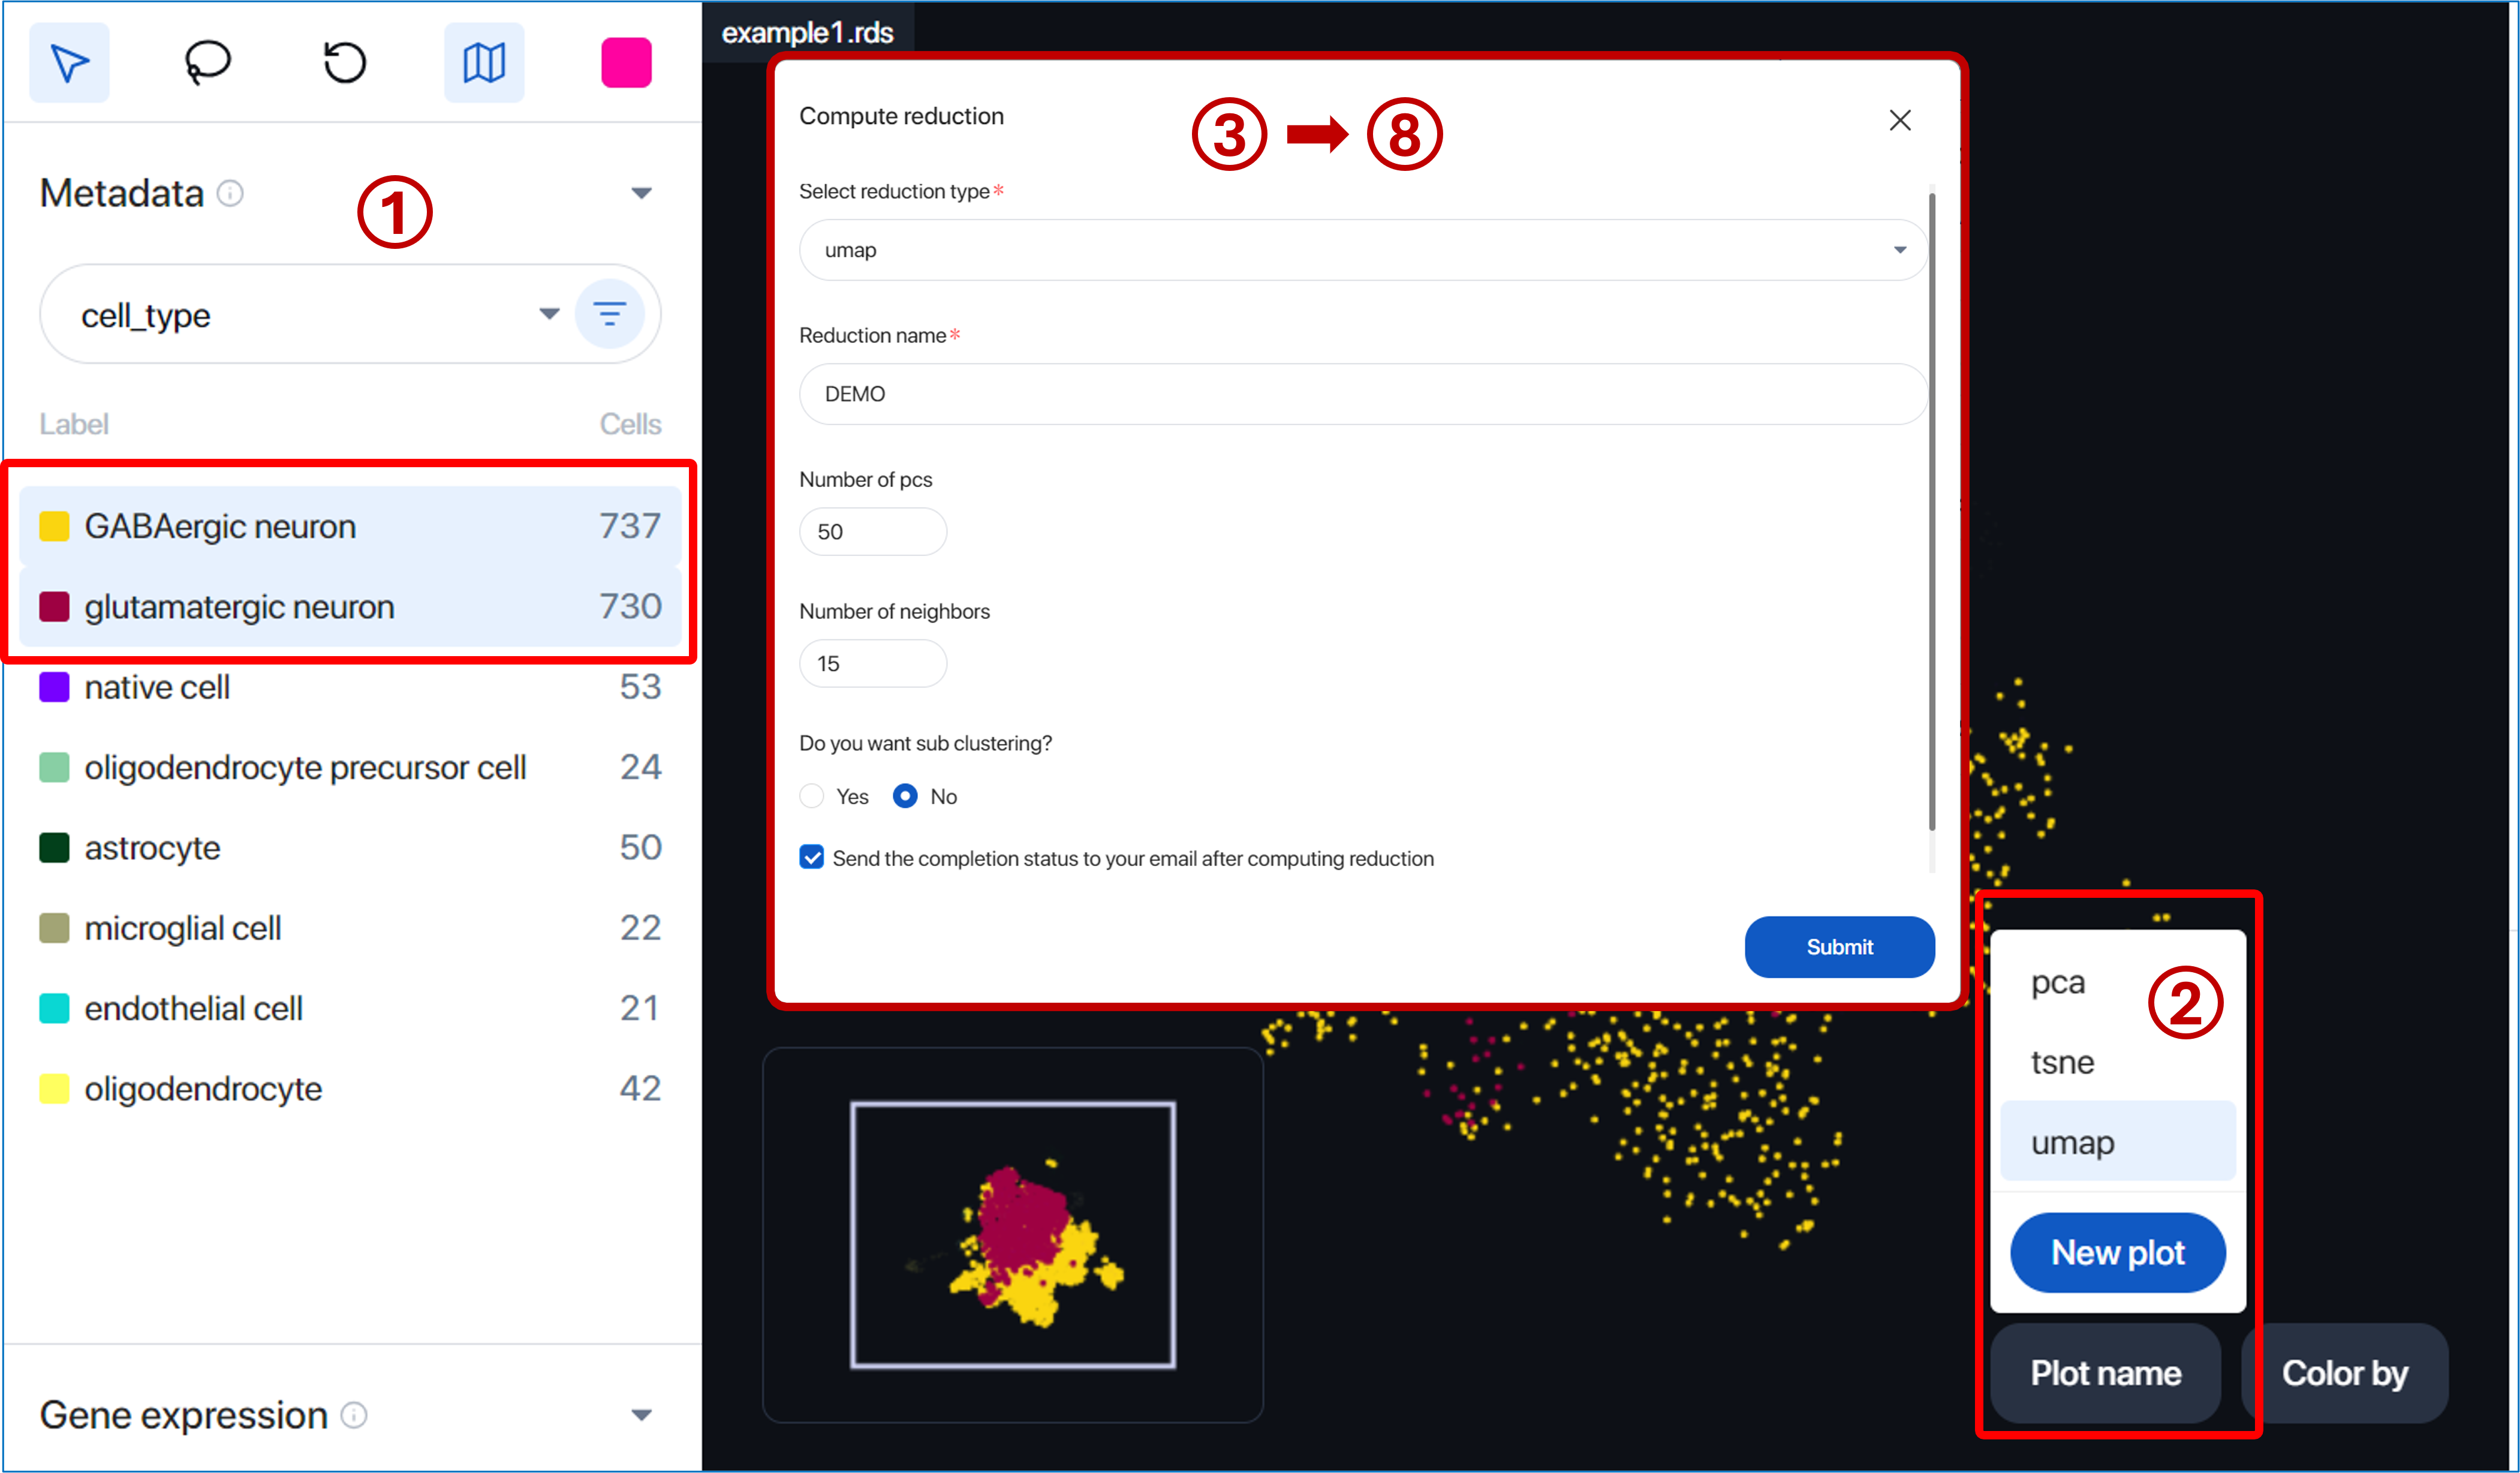
Besides, with the selected cells, the user can also create a new plot with new tSNE/UMAP running, sub-clustering, and Louvain clustering by following the steps below:
- Select the cells
- Click on “Plot name” and “New plot”
- Select reduction type: tsne or umap
- Input reduction name
- Select the number of principal components (pca); by default, 50 pcs are selected to run the reduction
- Select the number of perplexity (for tsne) & number of neighbors (for umap)
- Answer the question ‘Do you want to subcluster?’
If you want to subset the selected cells and run the clustering, click ‘Yes’ as an answer and set up the ‘Number of resolution.’ If you don’t want to subset the selected cells but only want to compute the new reduction plot, click ‘No’ as an answer. - Click ‘Submit’
After completing the steps, the new reduction plot will be displayed in the scatter plot with the clustering result shown in the metadata panel.
By clicking on 'Plot name', you can access and switch between different plots for visualization in the scatter plot.
5. SETTING UP PARAMETERS AND RUN CELLCHAT 
After selecting your target cells for the CellChat analysis, you can adjust the following parameters for your analysis:
- Analysis name:
Input a name for your analysis so you can distinguish between different analysis results.
- Select CellChat database:
- CellChat relies on ligand-receptor databases specific to different organisms for its analyses. Four available databases are:
- CellChatDB.human: ligand-receptor database for human
- CellChatDB.mouse: ligand-receptor database for mouse
- PPI.human: protein interaction database for human
- PPI.mouse: protein interaction database for mouse

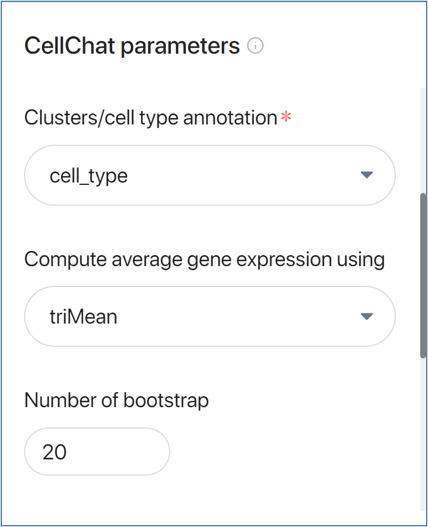
- Clusters/cell type annotation:
Your dataset may contain different metadata fields that define cell types/cell clusters. Choose one of these metadata fields to annotate the cells for your analysis.
- Compute average expression using:
Choose one of four methods to compute the average expression of genes within each cell type or cluster:
- triMean: Trimmed mean calculation.
- truncatedMean: Truncated mean calculation.
- thresholdedMean: Threshold-based mean calculation.
- median: Median calculation.
- Number of bootstrap:
Set the number of bootstraps in the resampling process. Increasing this number will increase the accuracy of the analysis but also the running time.
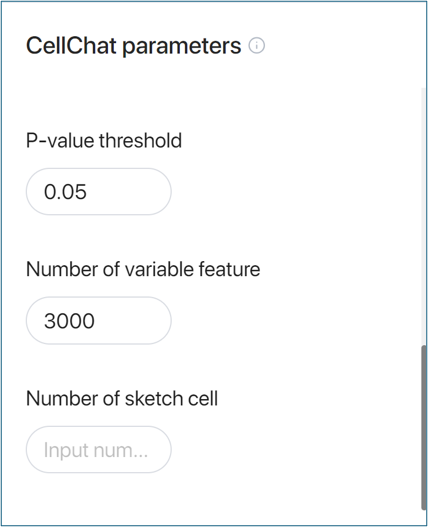
- p-value threshold:
Set the significance level for the statistical tests performed during the analysis.
- Number of variable features:
Define the number of top variable features (genes/proteins) to be used in the analysis.
- Number of sketch cells:
In case you have a big dataset, you can choose to sketch your dataset into a smaller number of cells to reduce running time.
There will be notifications pop up when the analysis is started and after it is finished. You can also view the notification using the notification icon in the management corner.
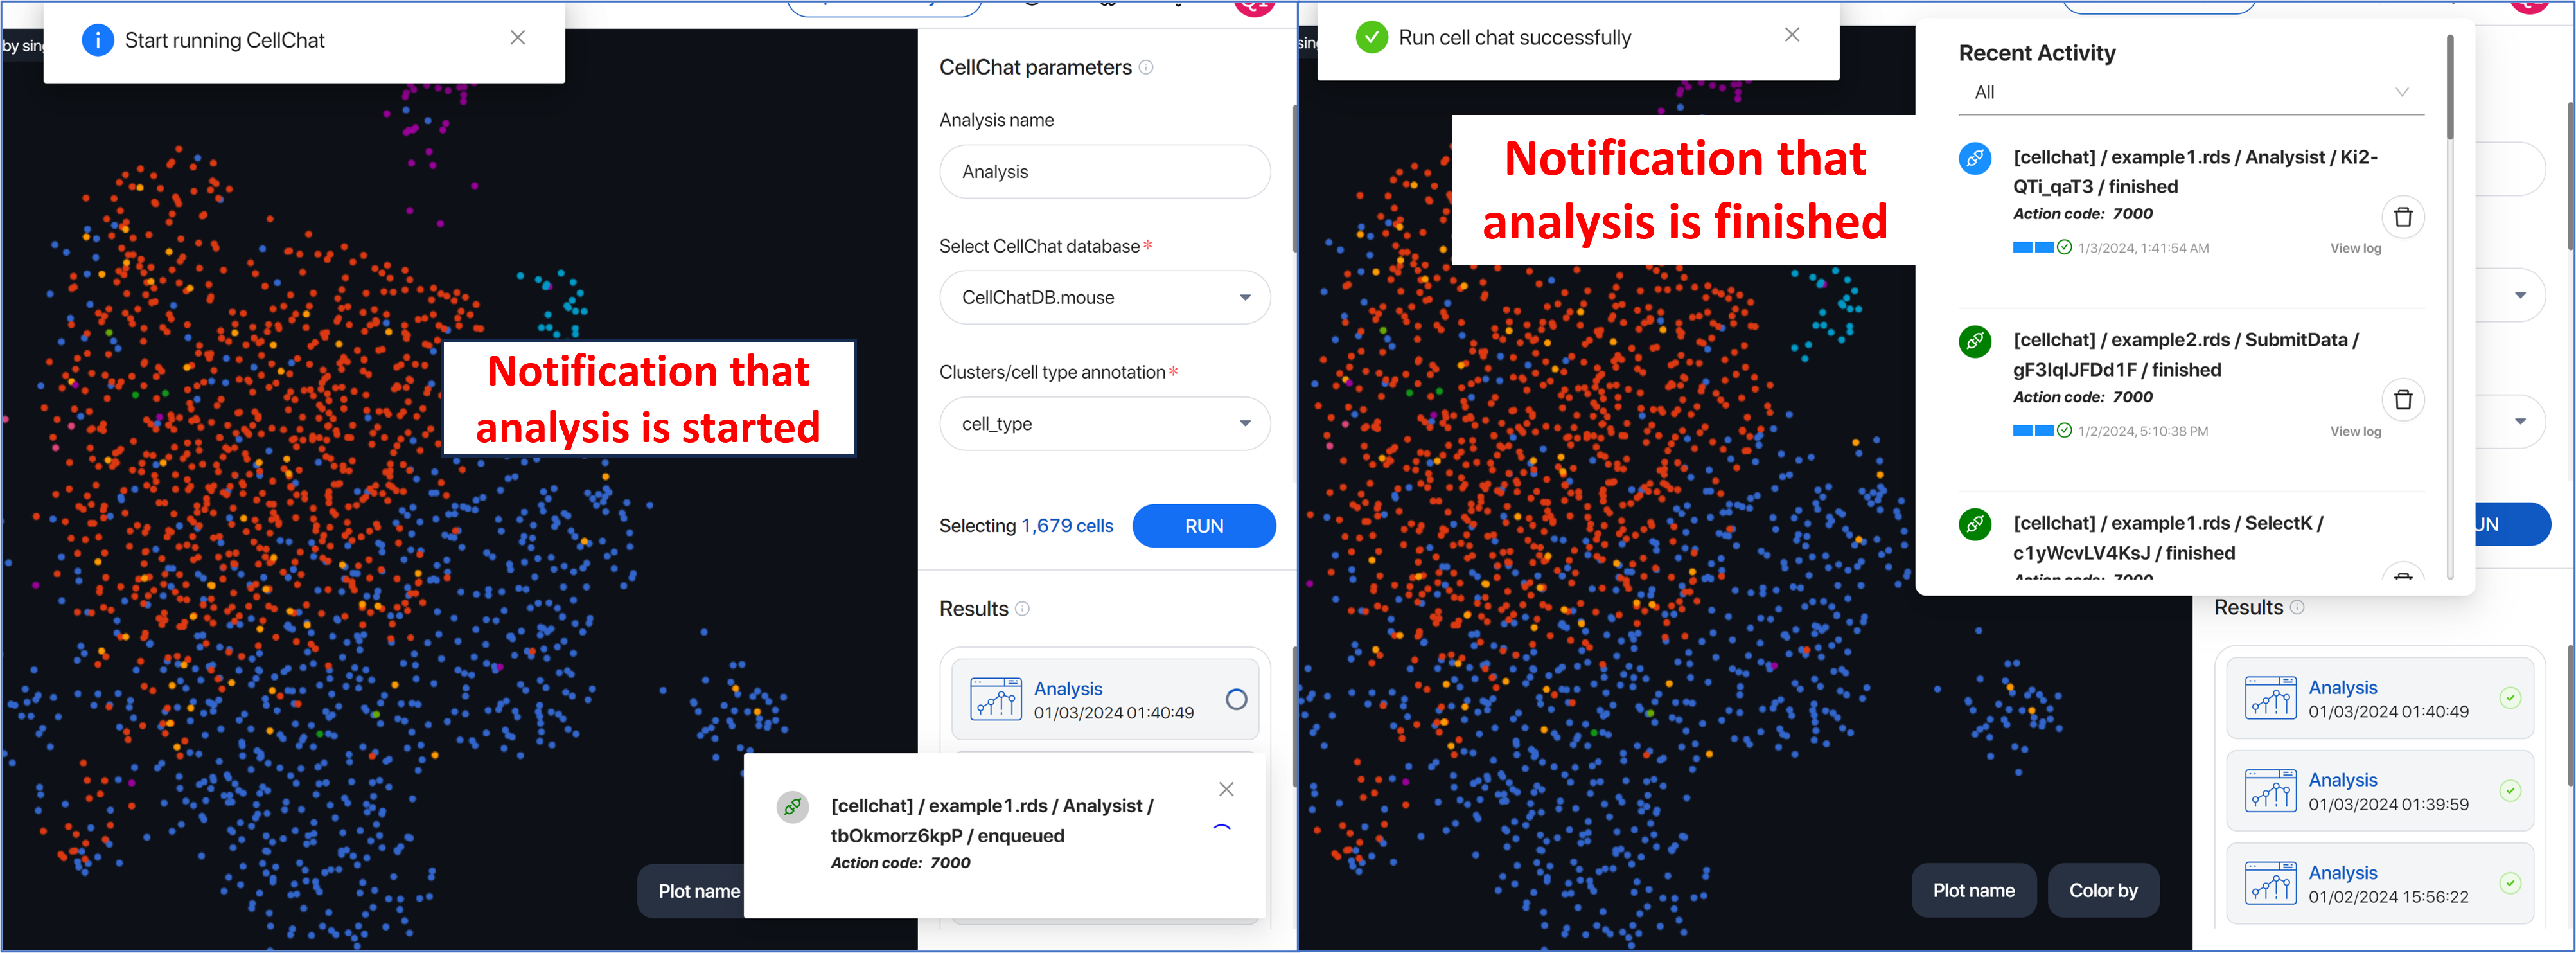
View all the analyses that have been run in the Result section under the Parameter box.
Click on the three dots either to view the log information or delete the analysis result.
6. POST-ANALYSIS 
After running the CellChat analysis, the application will show you this first interface with an initial overview of the results and options for you to run further analysis:
-
Cell-cell interaction: Exploring cell signaling networks.
-
Pathway analysis: Analysis of pathways.
-
Pattern analysis: Identify cell communication patterns.
Select an analysis and its suitable parameters on the right-hand side, different figures will be automatically and interactively displayed in the center of your screen.
Cell-cell interactions 
Initially, the application will show you the overview of cell-cell interactions between cell types. Switch between 3 features:
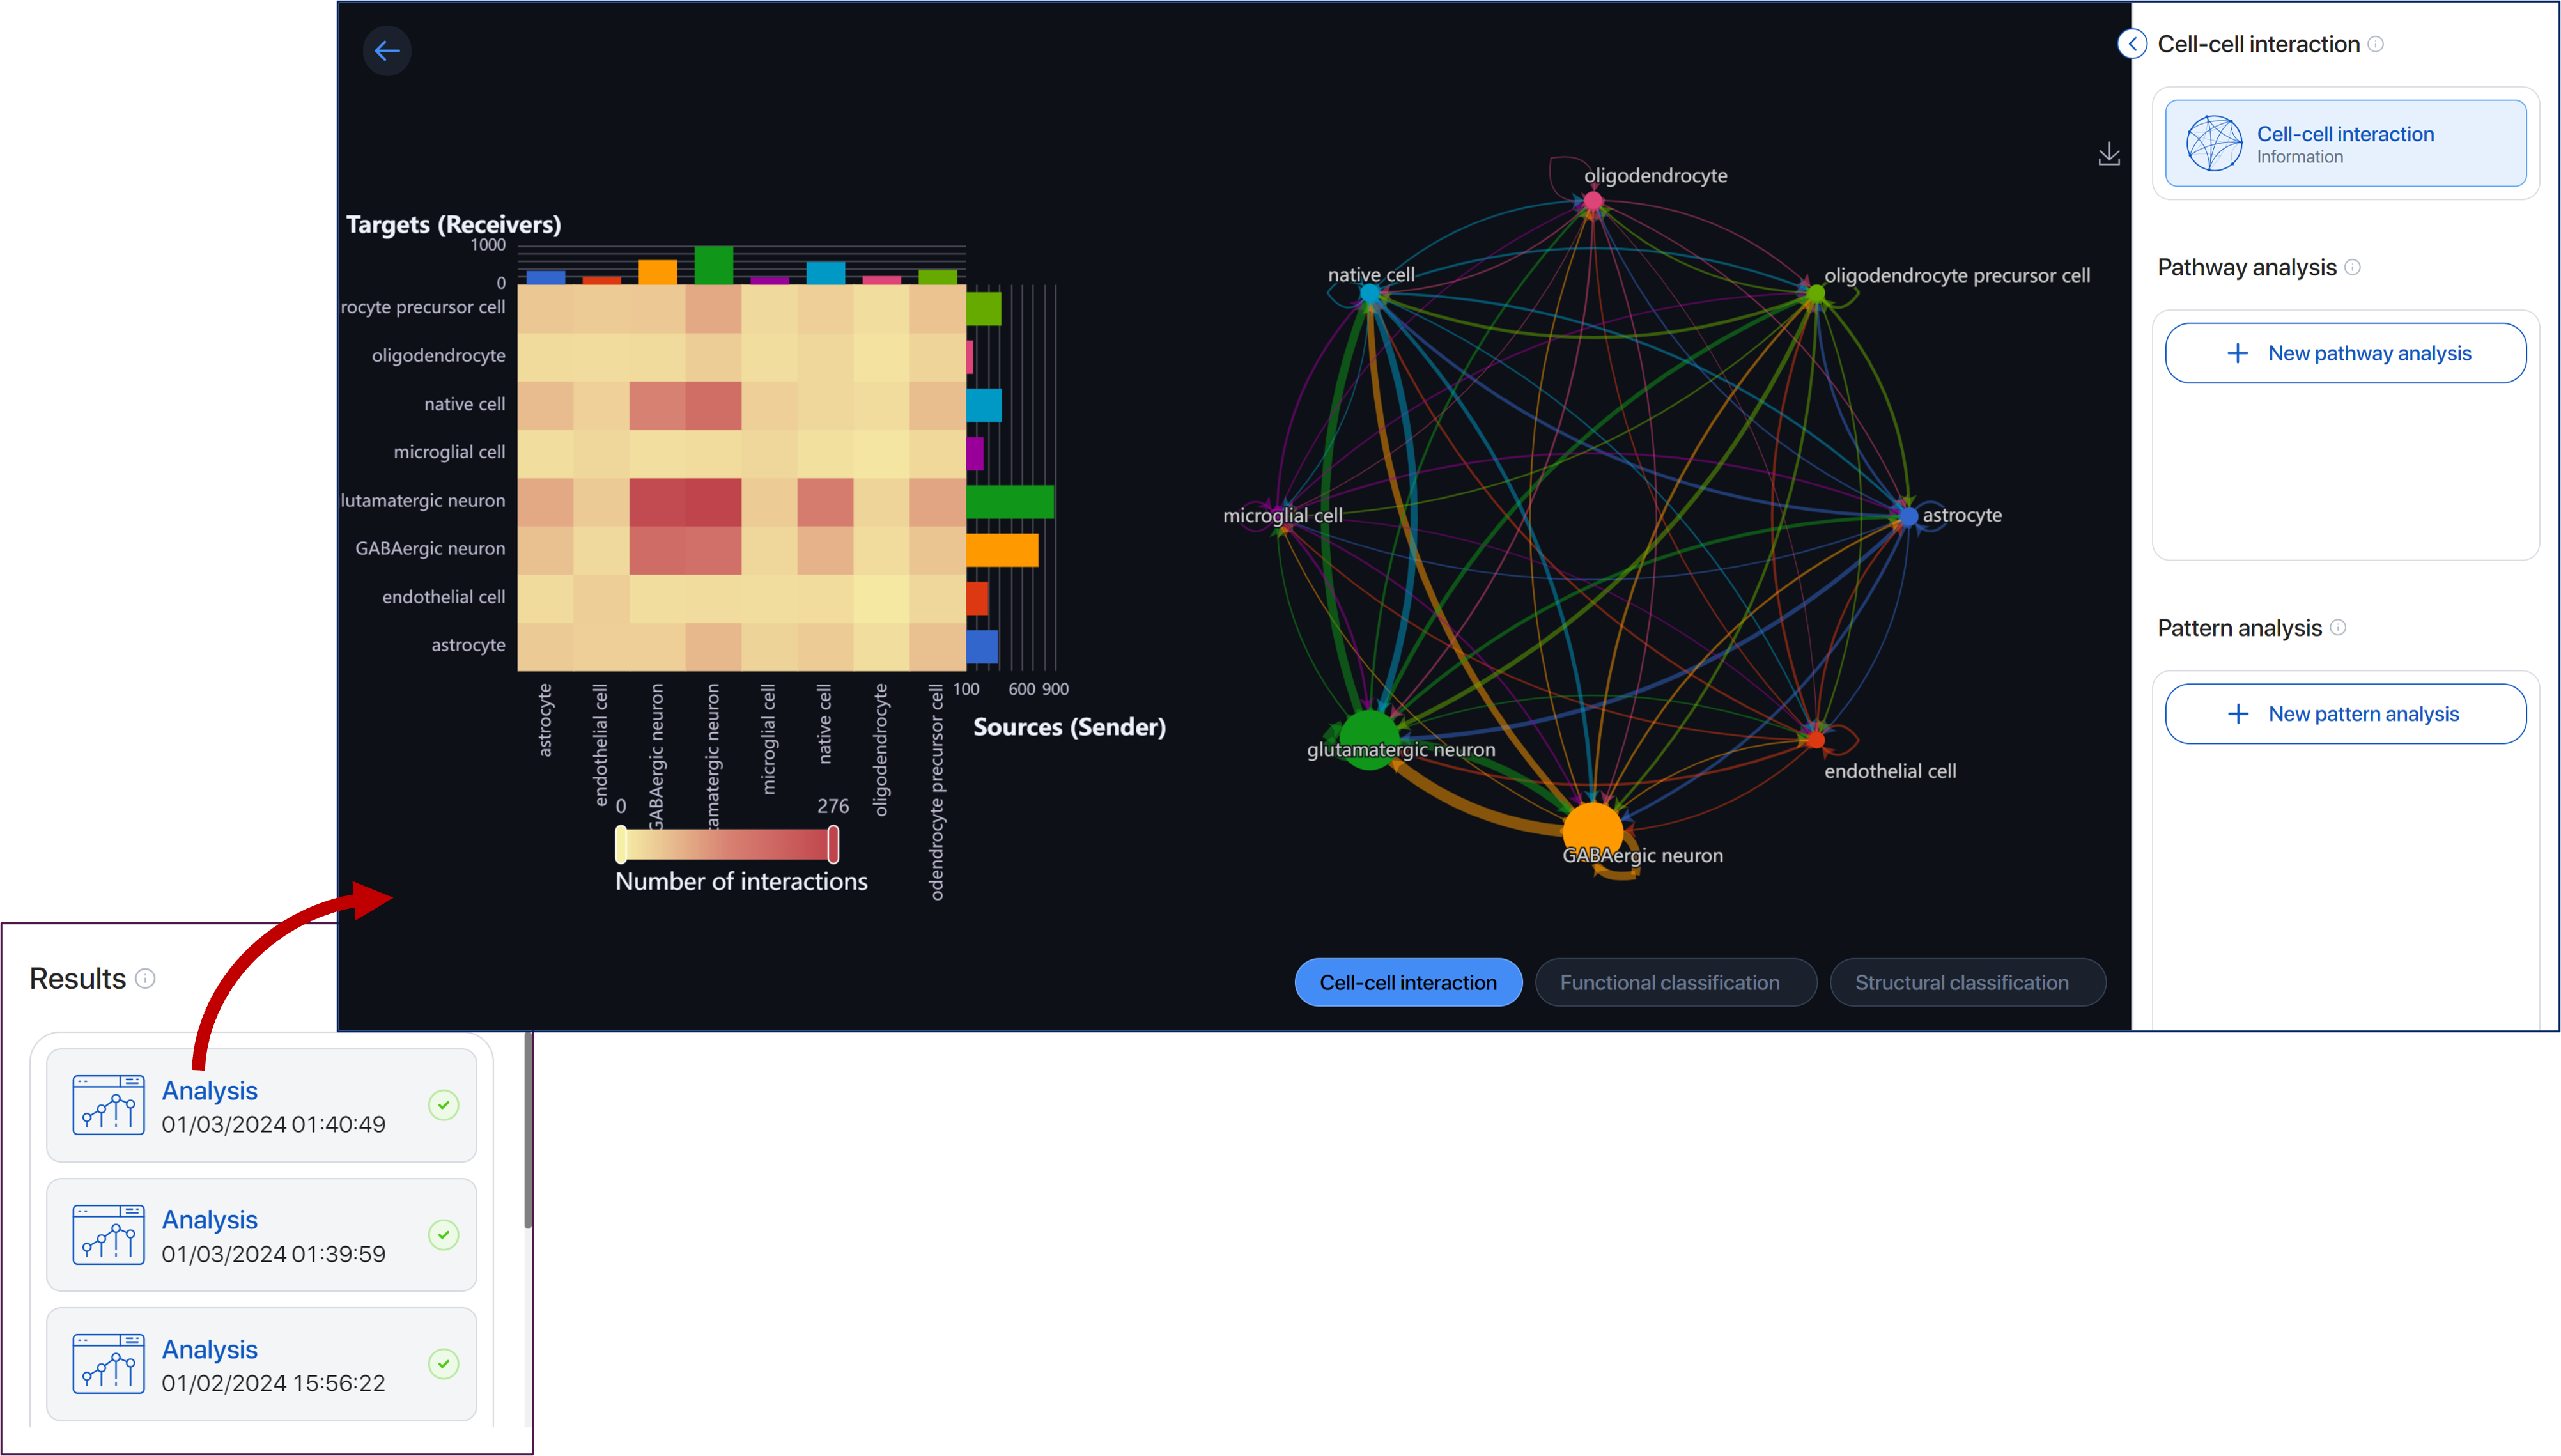
Cell-cell interaction 
- Heatmap 
Shows the number of interactions between pairs of sender and receivers in the intercellular communication network.
-
The senders are on the x-axis, and the receivers are on the y-axis. The bars on the x- and y-axis show the total interaction of the respective cell type.
-
Hover over the heatmap to view the total interactions between each pair of sender-receiver.
-
Click on a cell to view the data table containing the analysis result of this sender-receiver pair.

- Adjust the color bar to filter the pairs of receivers-sender with the specific number of interactions then the heatmap and circle plot will adjust respectively.
- Circle plot 
A circular visualization used to visualize the overall interactions among cell types.

-
Each node represents a cell type, the size is proportional to the number cells of that type.
-
Each arrow represents an interaction where it points to the receiver and its weight is proportional to the number of this interaction.
-
Hover over the node to view all the interactions involving that cell type.
-
When you hover over an arrow, the number of interactions will be displayed while other interactions including arrows and nodes will be dimmed.

Include/exclude cell types in the group of sender or receiver by clicking on the name tags.
Turn off the Two-way button to only view the interaction according to the senders and receivers you just set. Turn on to include the interactions with the receiver(s) playing the role of the sender(s).
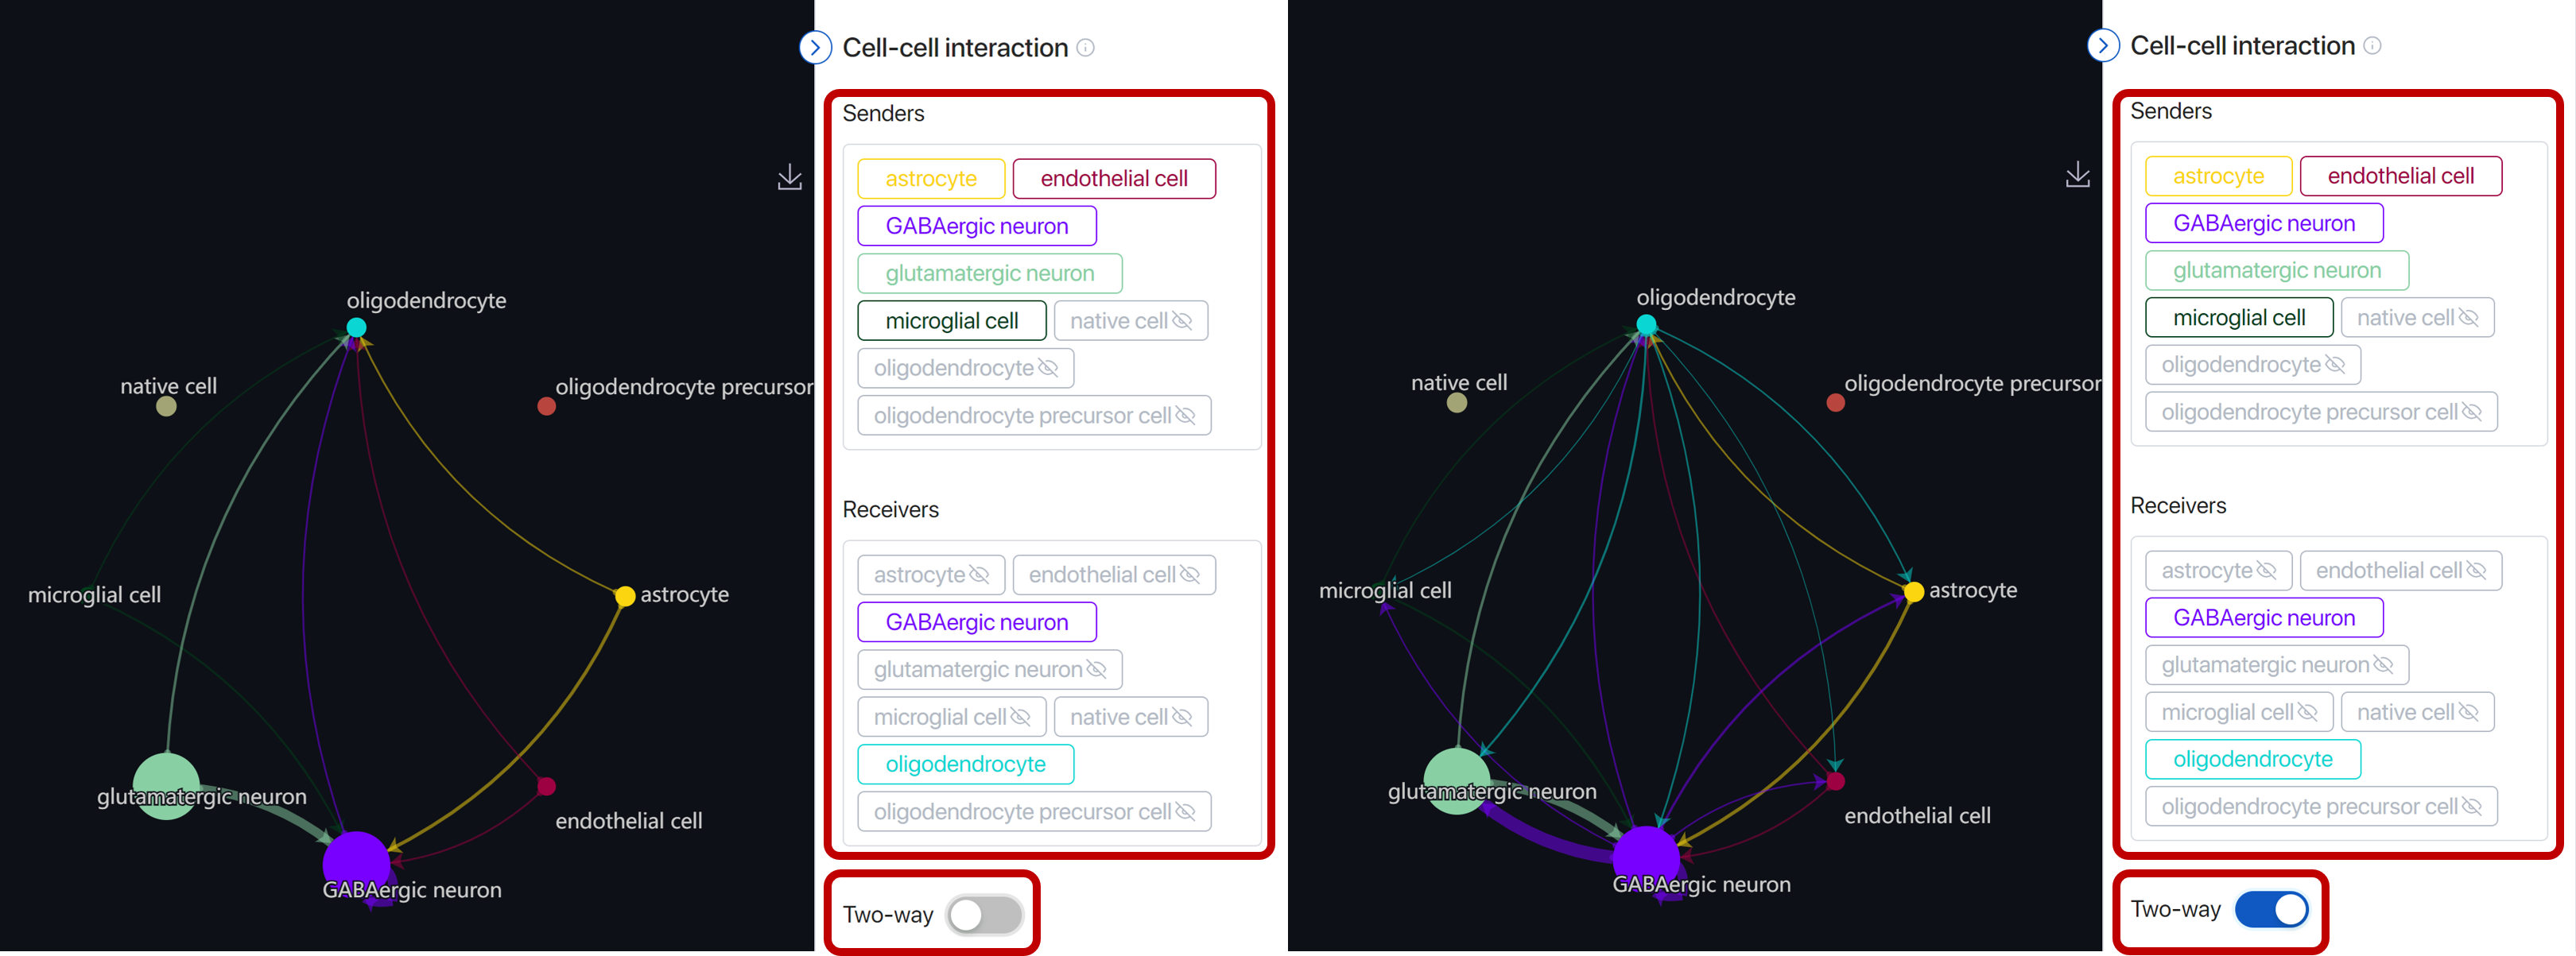
When you include/exclude the sender/receiver, the circle plot will change correspondingly but the heatmap will remain. Click on Update heatmap to view the new heatmap. Click on reset to reset back to the initial setting.
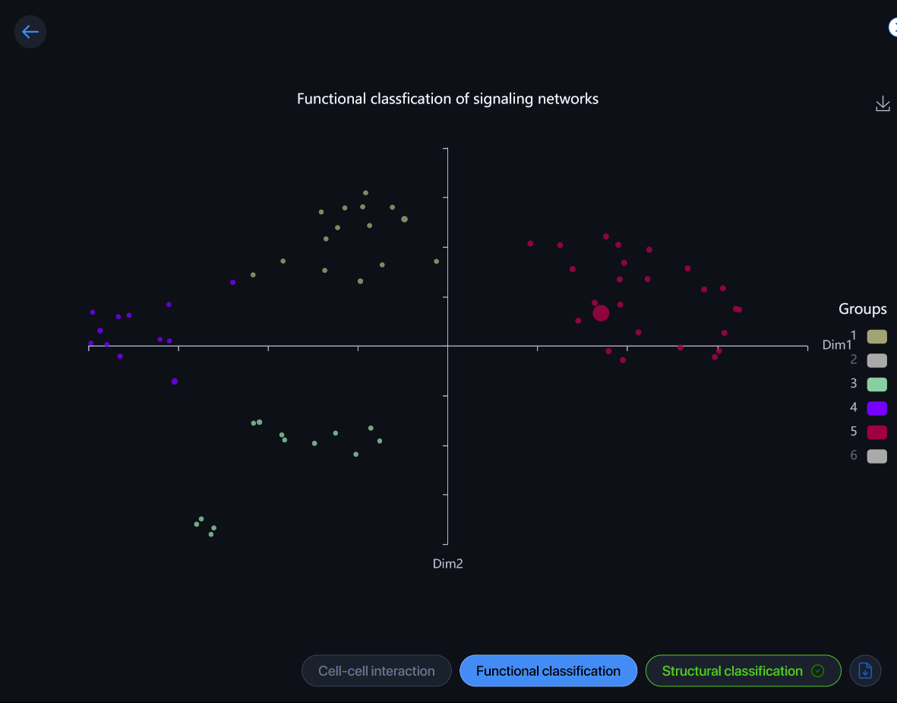
Functional classification 
CellChat can analyze and group significant pathways based on their functional or structural similarities. Functional classification feature groups pathways with similar major senders and receivers, indicating the pathways exhibit similar and/or redundant roles.
Each dot represents a pathway and is colored by the group it belongs to. Hover over the dot to view the pathway. Click on the dot to view and download the data of the group.
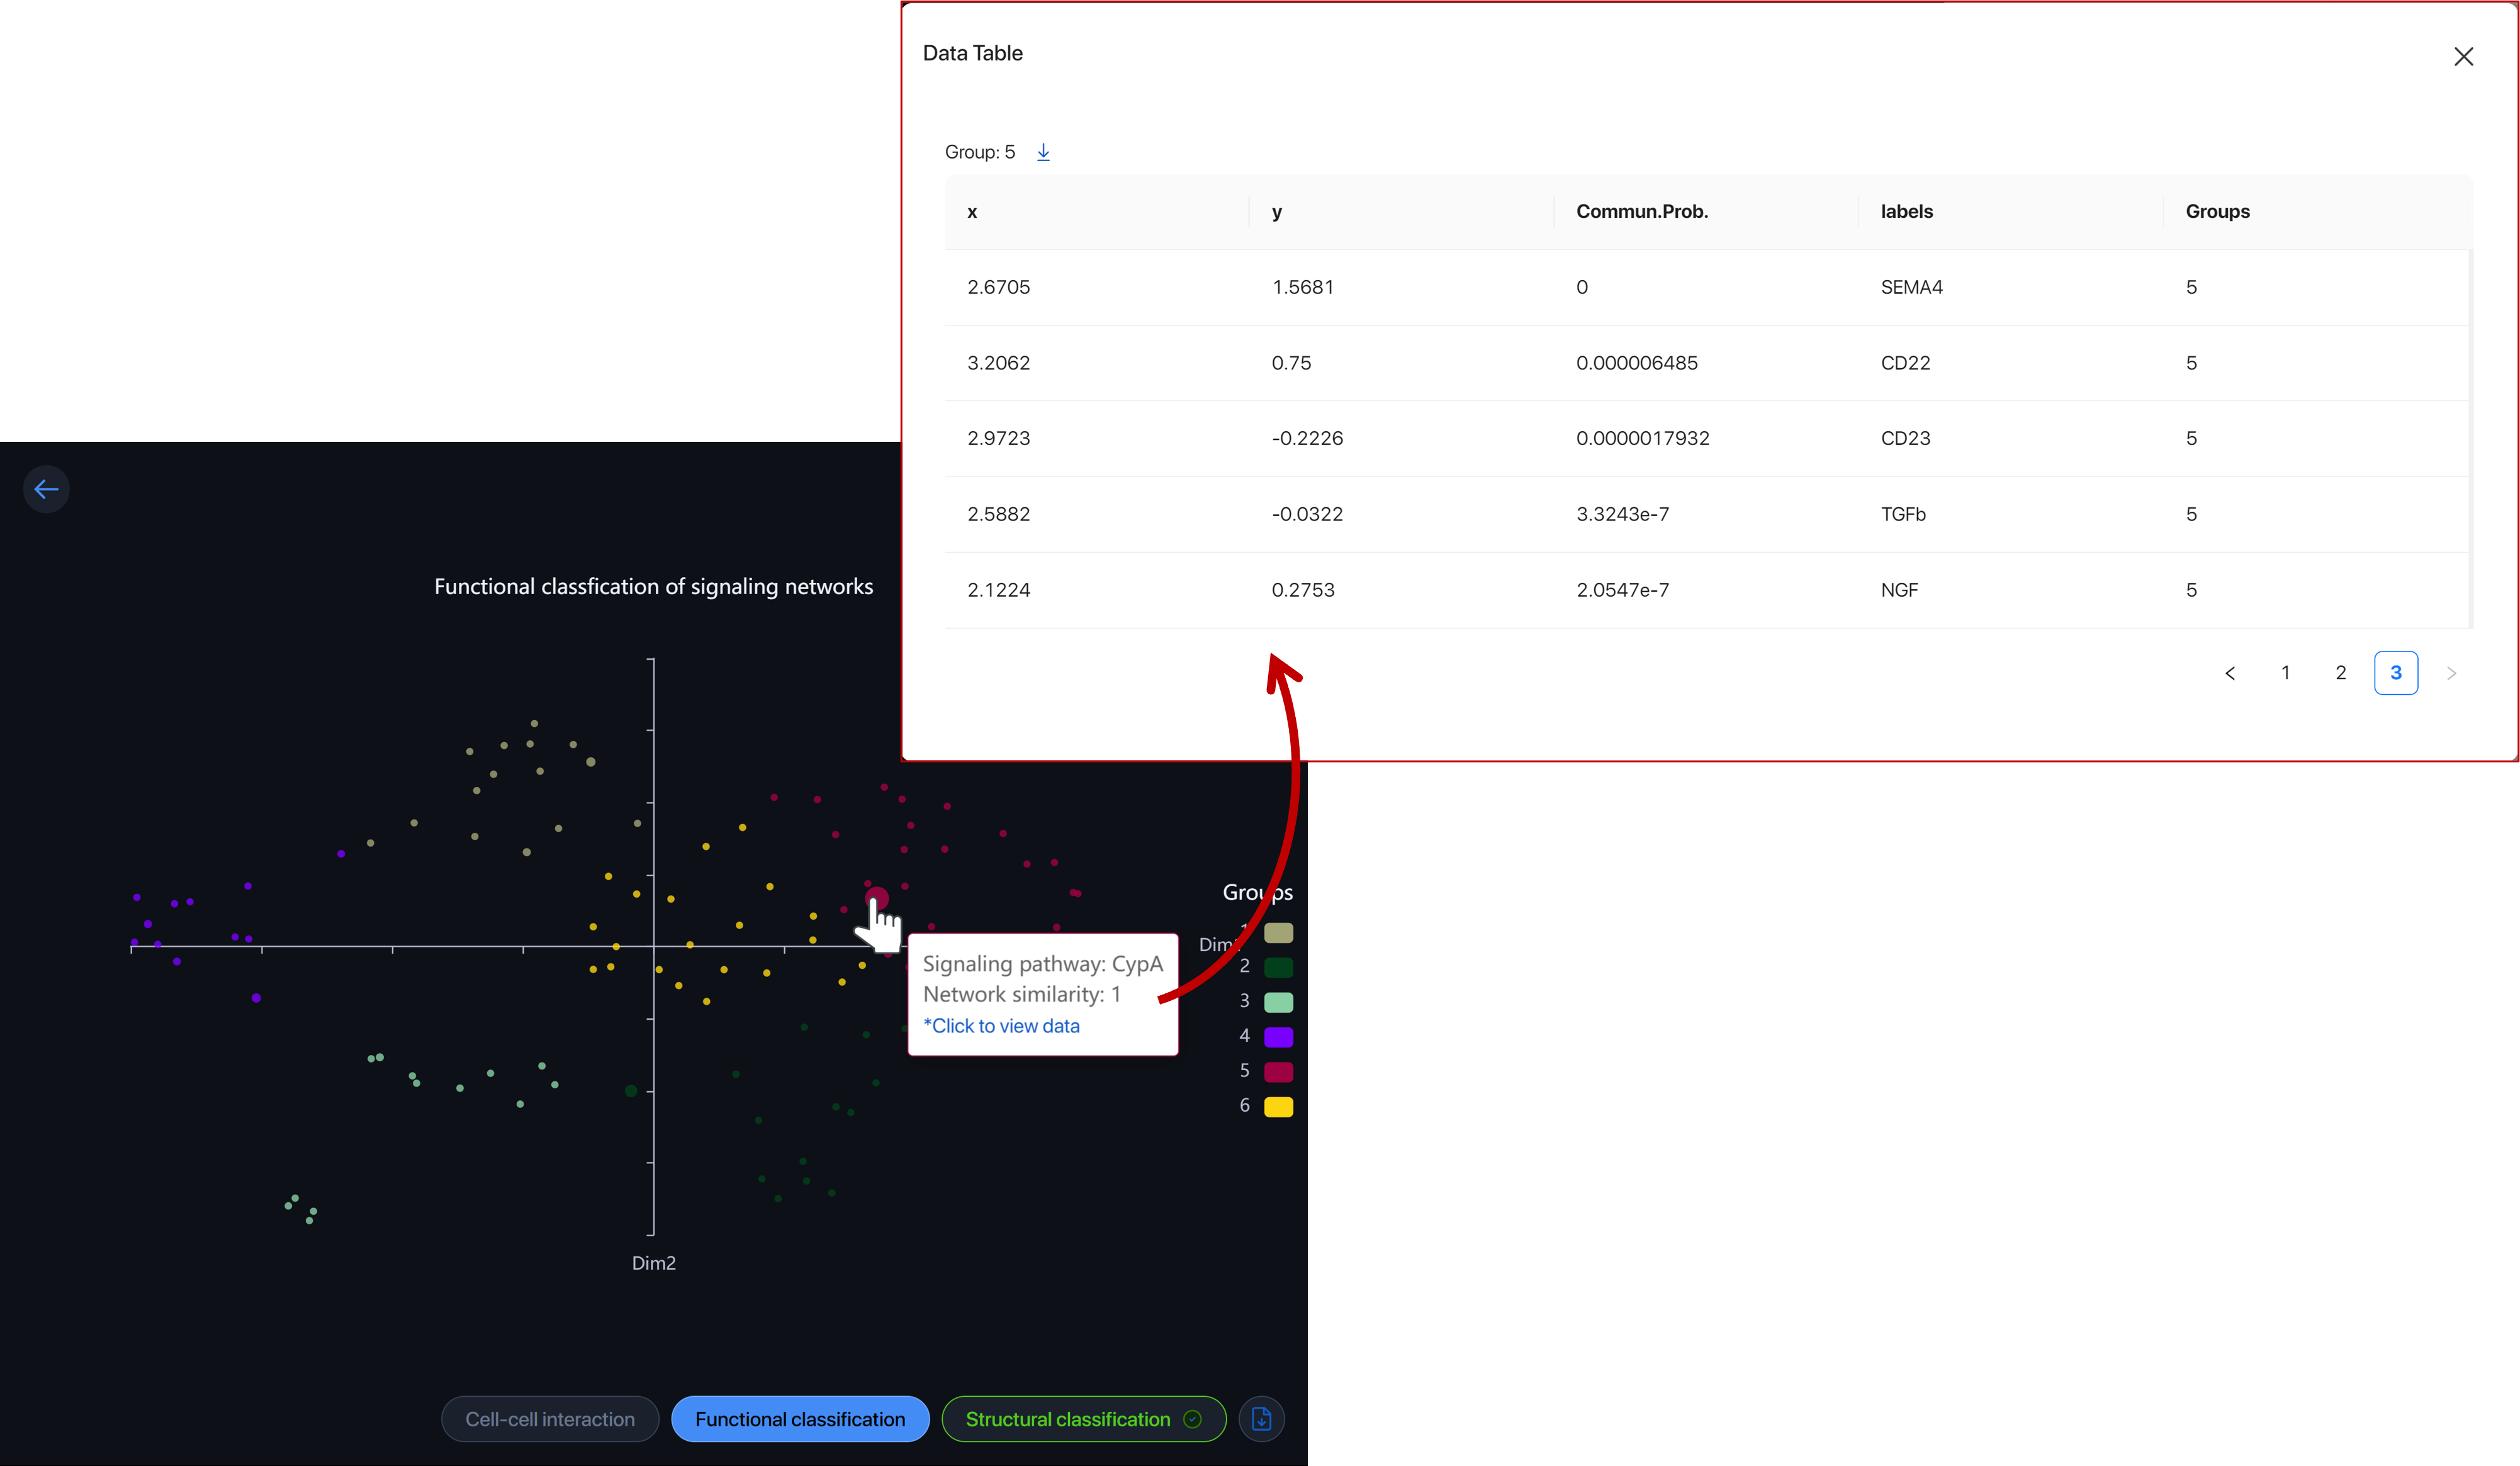
Click on the color box to hide/view the functional-similar group.
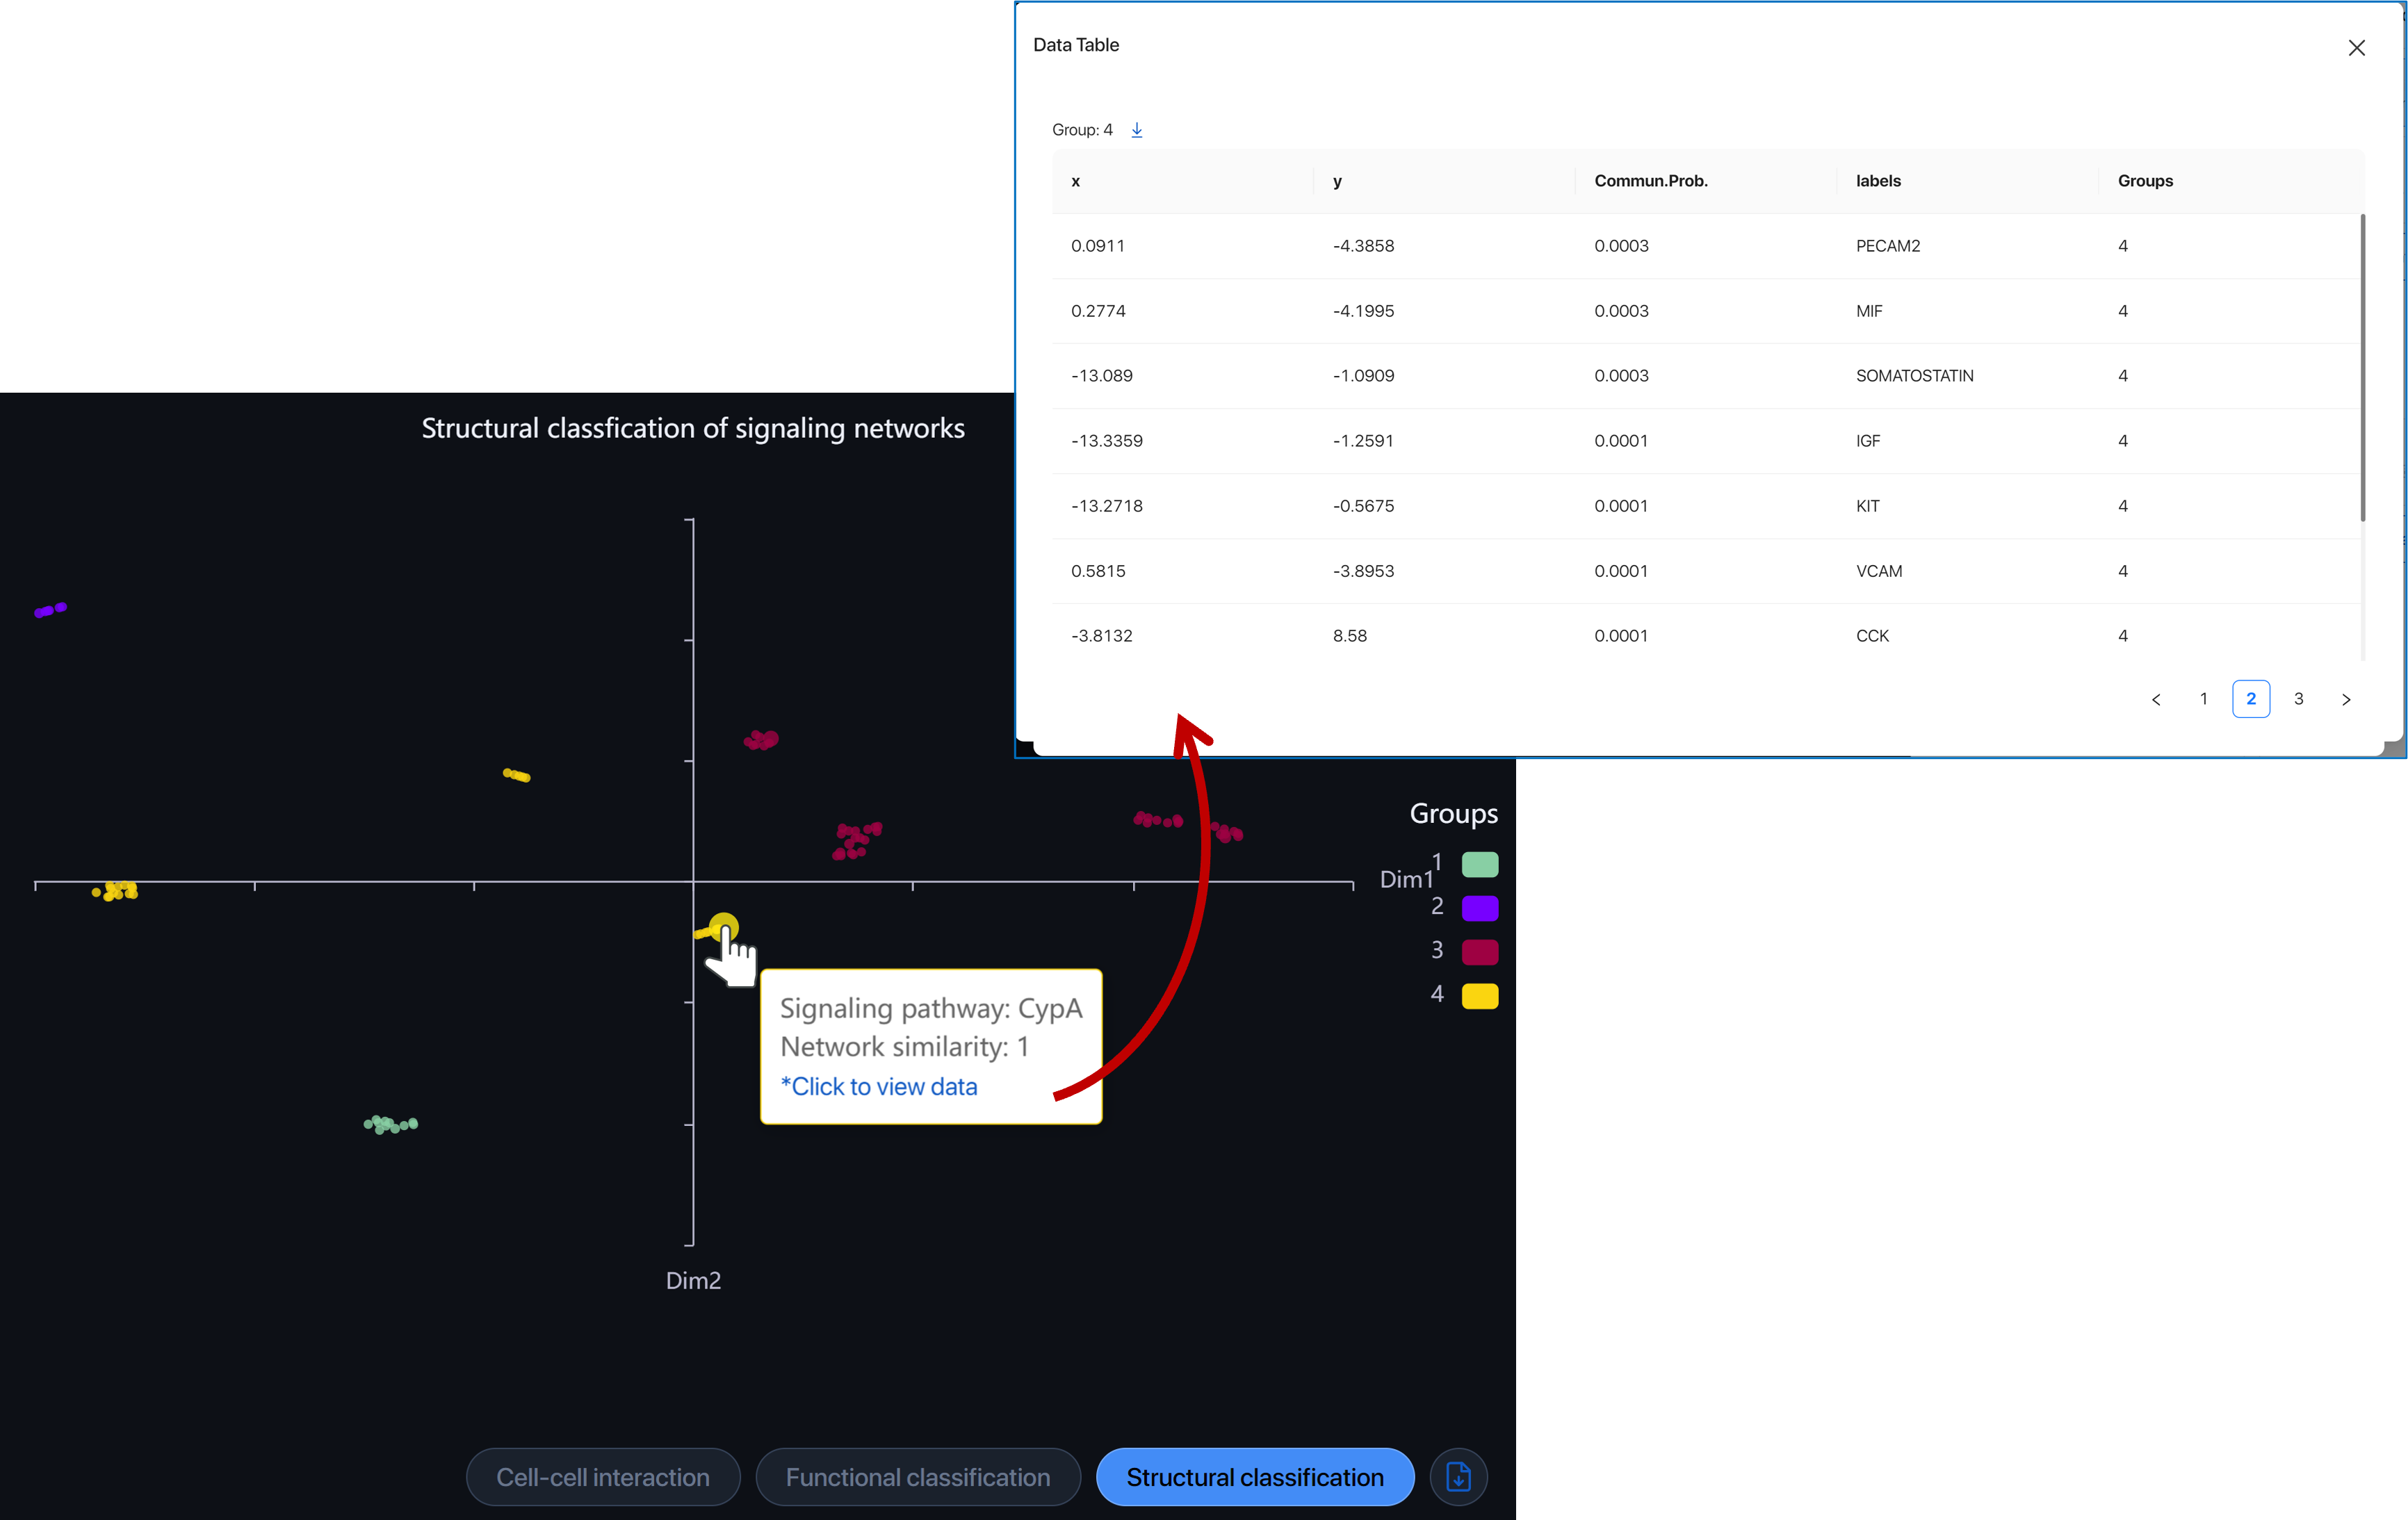
Structural classification 
Structural classification feature groups pathways with similarities in structure without considering the similarity in senders/receivers. Hover over the dot to view the pathway. Click on the dot to view and download the data of the group.
Pathway analysis 
CellChat provides you with different ways to analyze and visualize the cell-cell communication network. In the “Pathway analysis” section, click on “New pathway analysis”.
Inside the parameter board:
-
Select a pathway you want to view.
-
Select receiver: Select the first group of cell types to view in the hierarchy plot. The second group will be assigned to the rest cell types.
Click run to perform and view the pathway analysis.
The result will show under the Pathway analysis section.
Click on the three dots to edit the name of the analysis or delete the analysis.
The application will show you on the first page an “Overview” of 4 results with different visualizations.

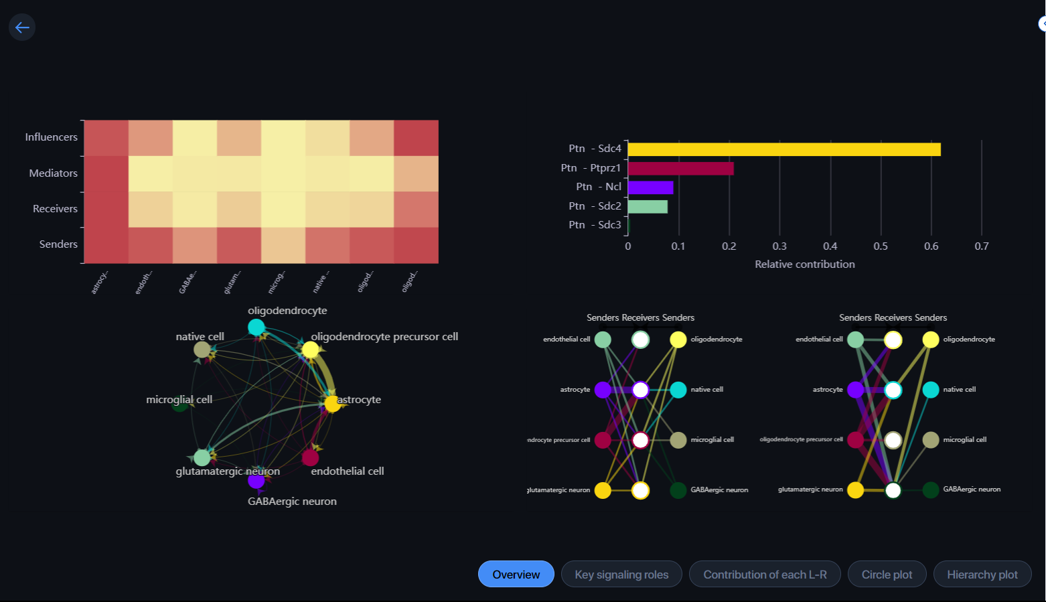
- Key signaling roles: In this section, the heatmap plot will show you the relative importance of each cell group based on the computed four network centrality measures of the signaling pathway.
A cell can play the role of sender, receiver, mediator, and/or influencer in the pathway. Hover over a cell to view the centrality score of the cell type with each role.
Alter the scale to filter the heatmap by Importance/Centrality score.

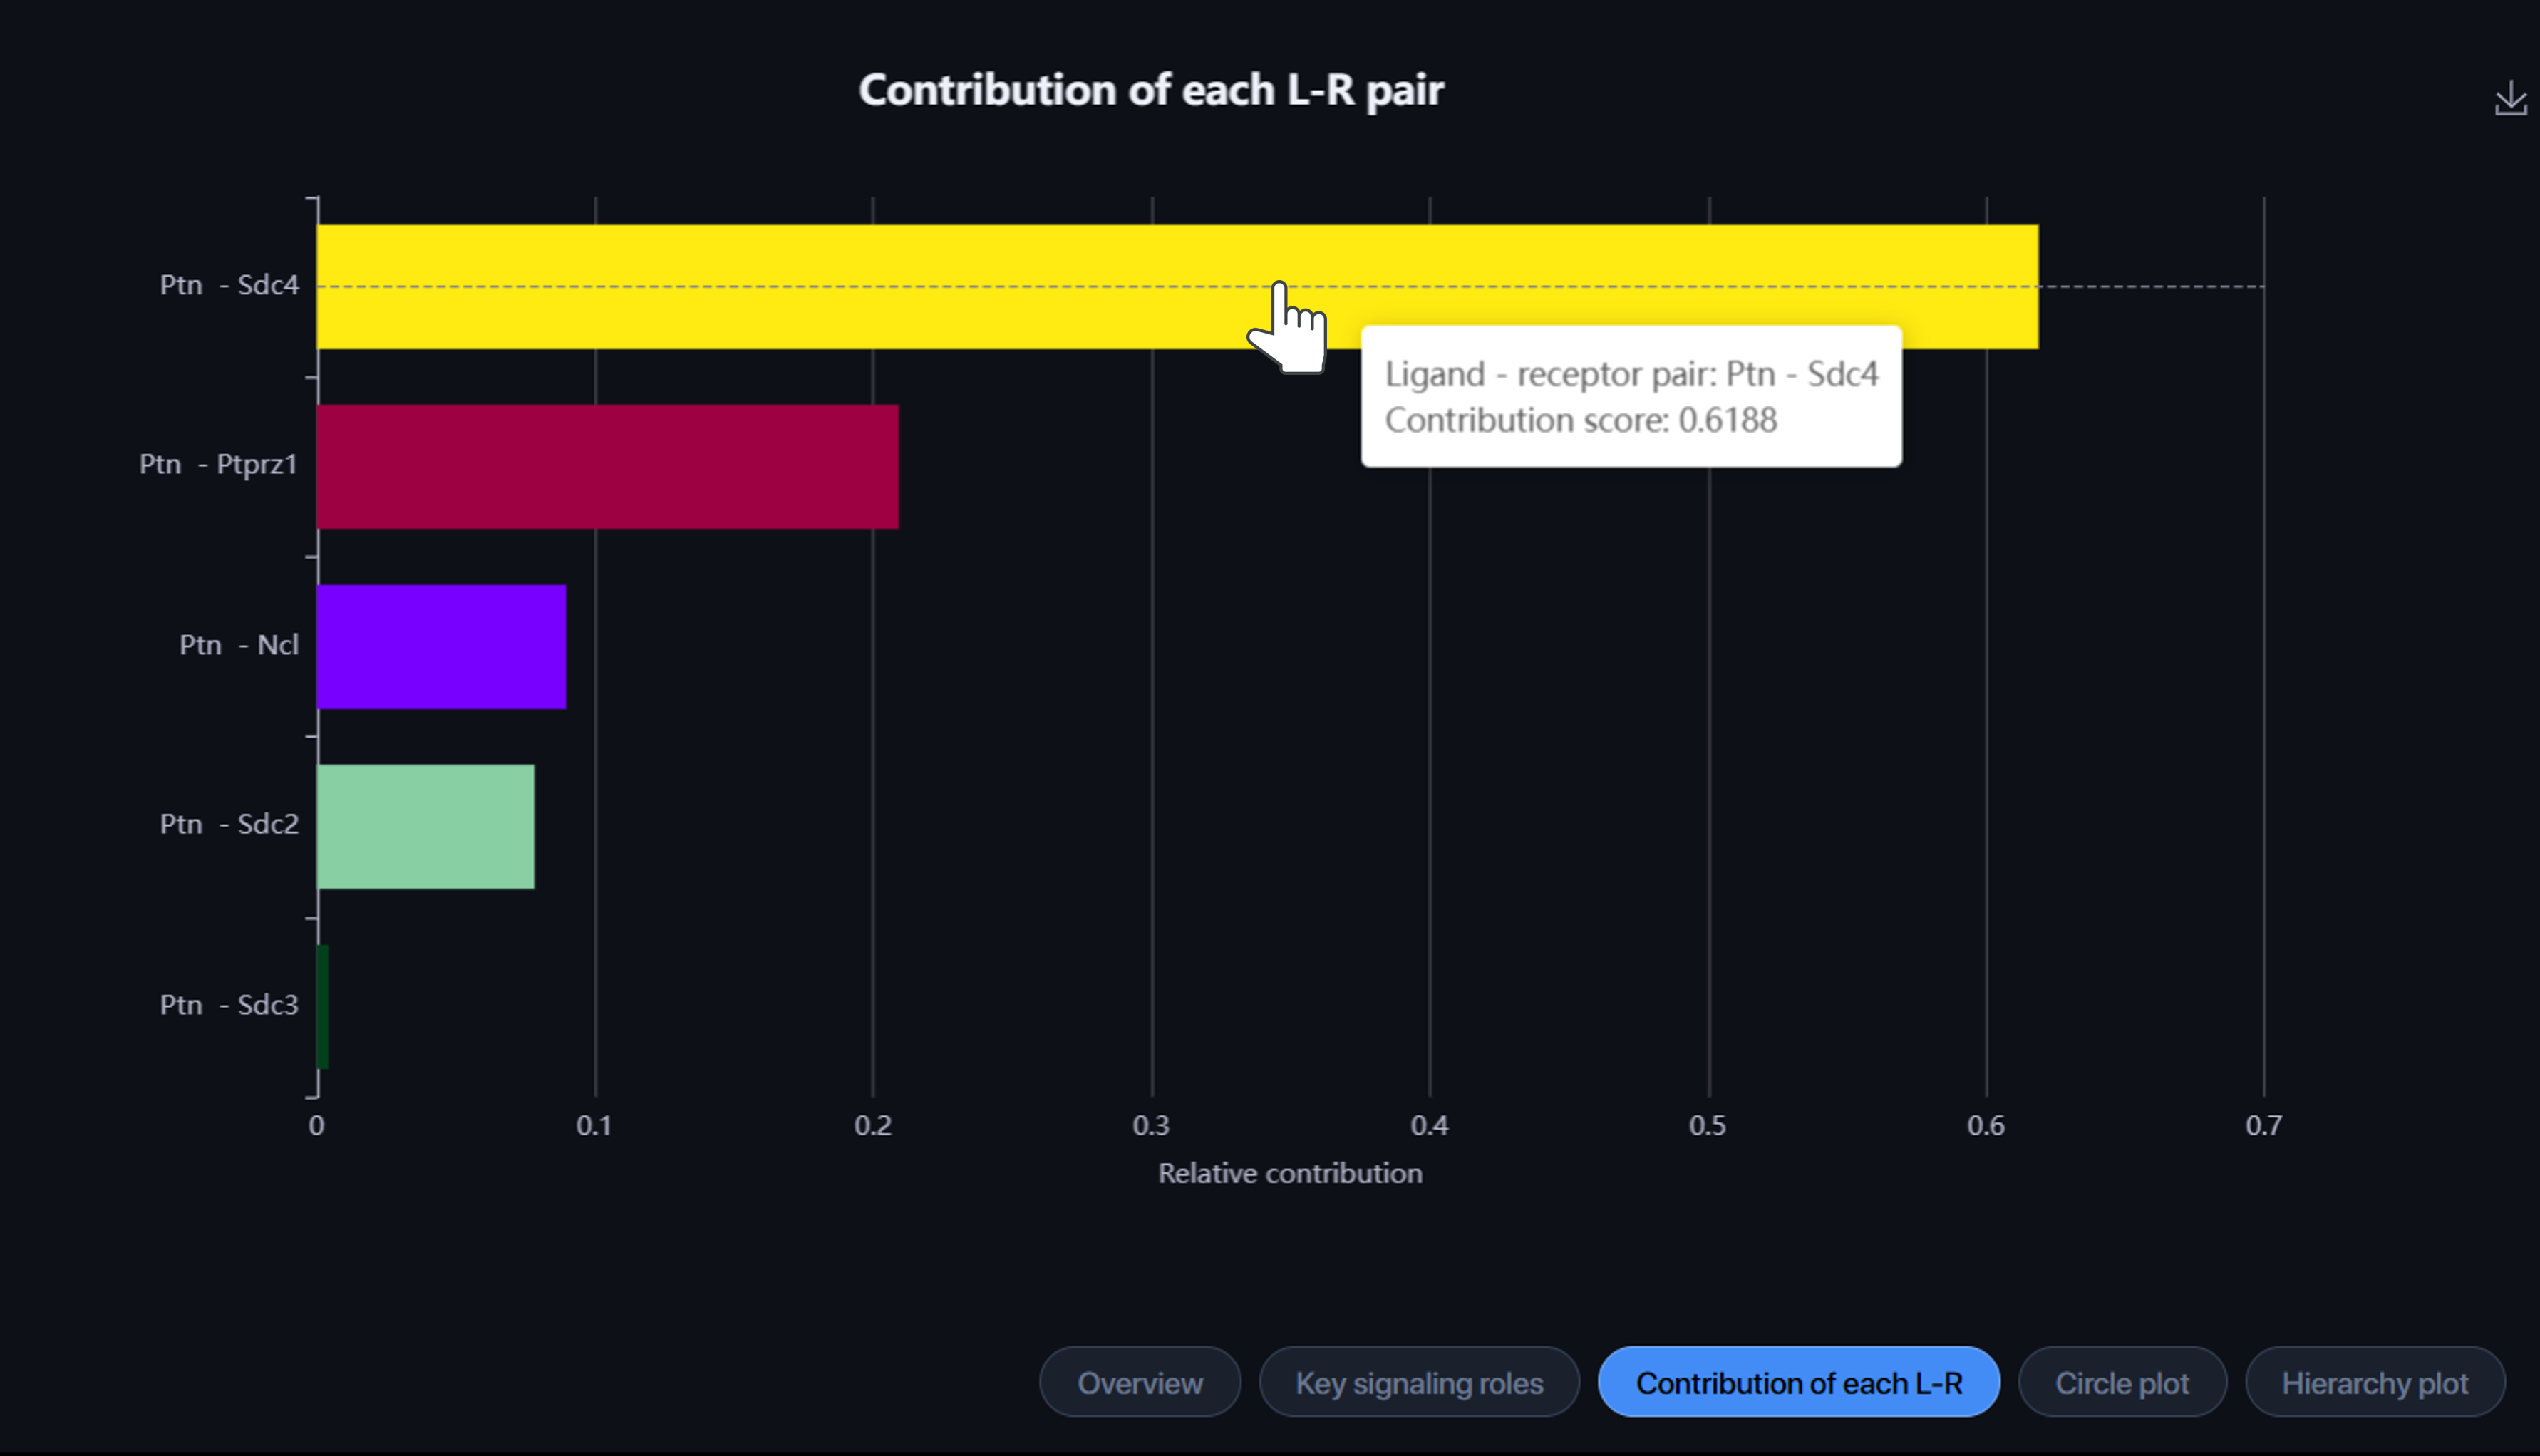
-
Contribution of each L-R: Let you visualize the contribution of each ligand-receptor (L-R) pair to the overall communication of the selected signaling pathway. Hover over the bar to view the L-R pair and its contribution score.
-
Circle plot: Show you the interaction network where the arrow points from sender to receiver. The arrow’s weight is proportional to the interaction weight, which is a summarization of the interaction weight of all L-R pairs related to that pattern. You can view this score by hovering over the arrow.

-
Hierarchy plot: In this section, you can view the autocrine and the paracrine of cell groups. In the parameter, the cell types selected in the “Select receiver” section will be grouped as Group 1 and the rest cell types will be grouped as Group 2.
-
The hierarchical plot on the left shows the autocrine and paracrine with Group 1 as the receiver.
-
The hierarchical plot on the right shows the autocrine and paracrine with Group 2 as the receiver.
-
The weight of each line is proportional to the interaction weight as described in the Circle plot.
-

Pattern analysis 
CellChat can predict key incoming and outgoing signals from cell types by using pattern recognition methods including Cophentic and Silhouette, which measure the stability of the number of patterns. In general, the number of patterns needs to be greater than 2 to have a biological meaning. A suitable number of patterns is where both Cophenetic and Silhouette values start to drop abruptly.
Click on the “New pattern analysis” button, the application will show you the diagram of Cophenetic and Silhouette measurements for Outgoing and Incoming signaling.

Based on these results, choose a suitable number of patterns and click the Run button.

An Overview page shows you the results visualized by the Dot plot and River plot.
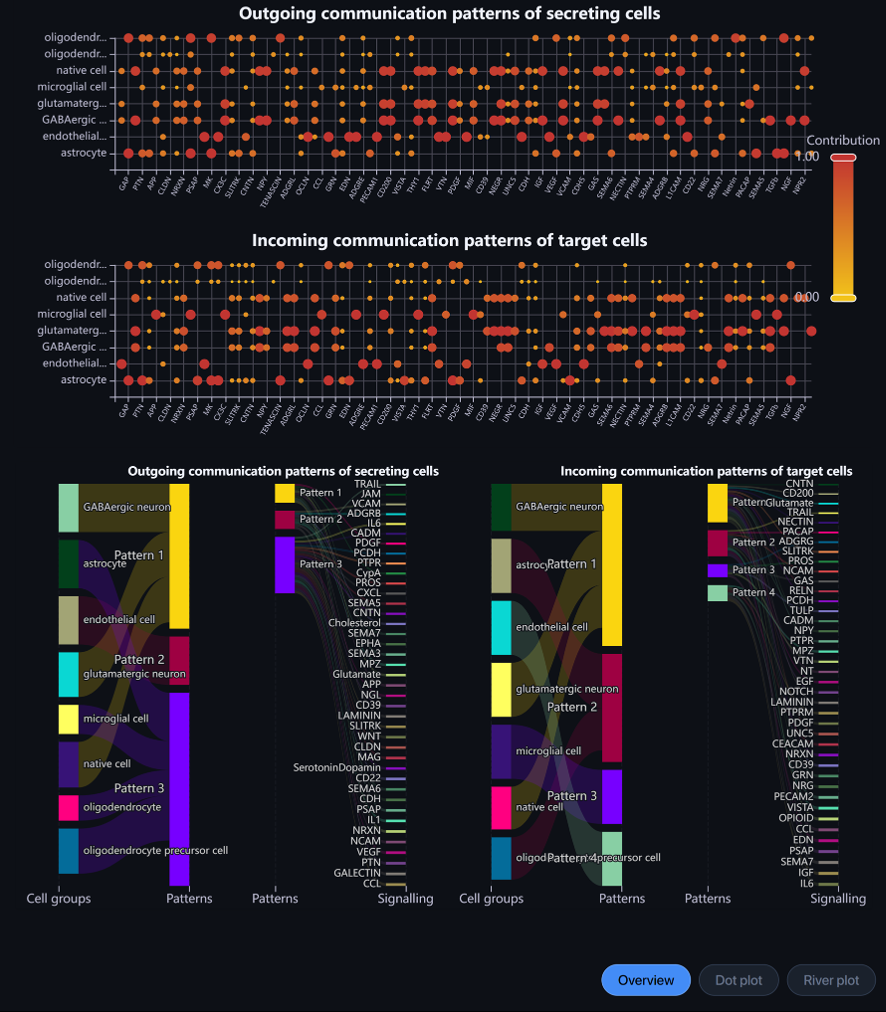
-
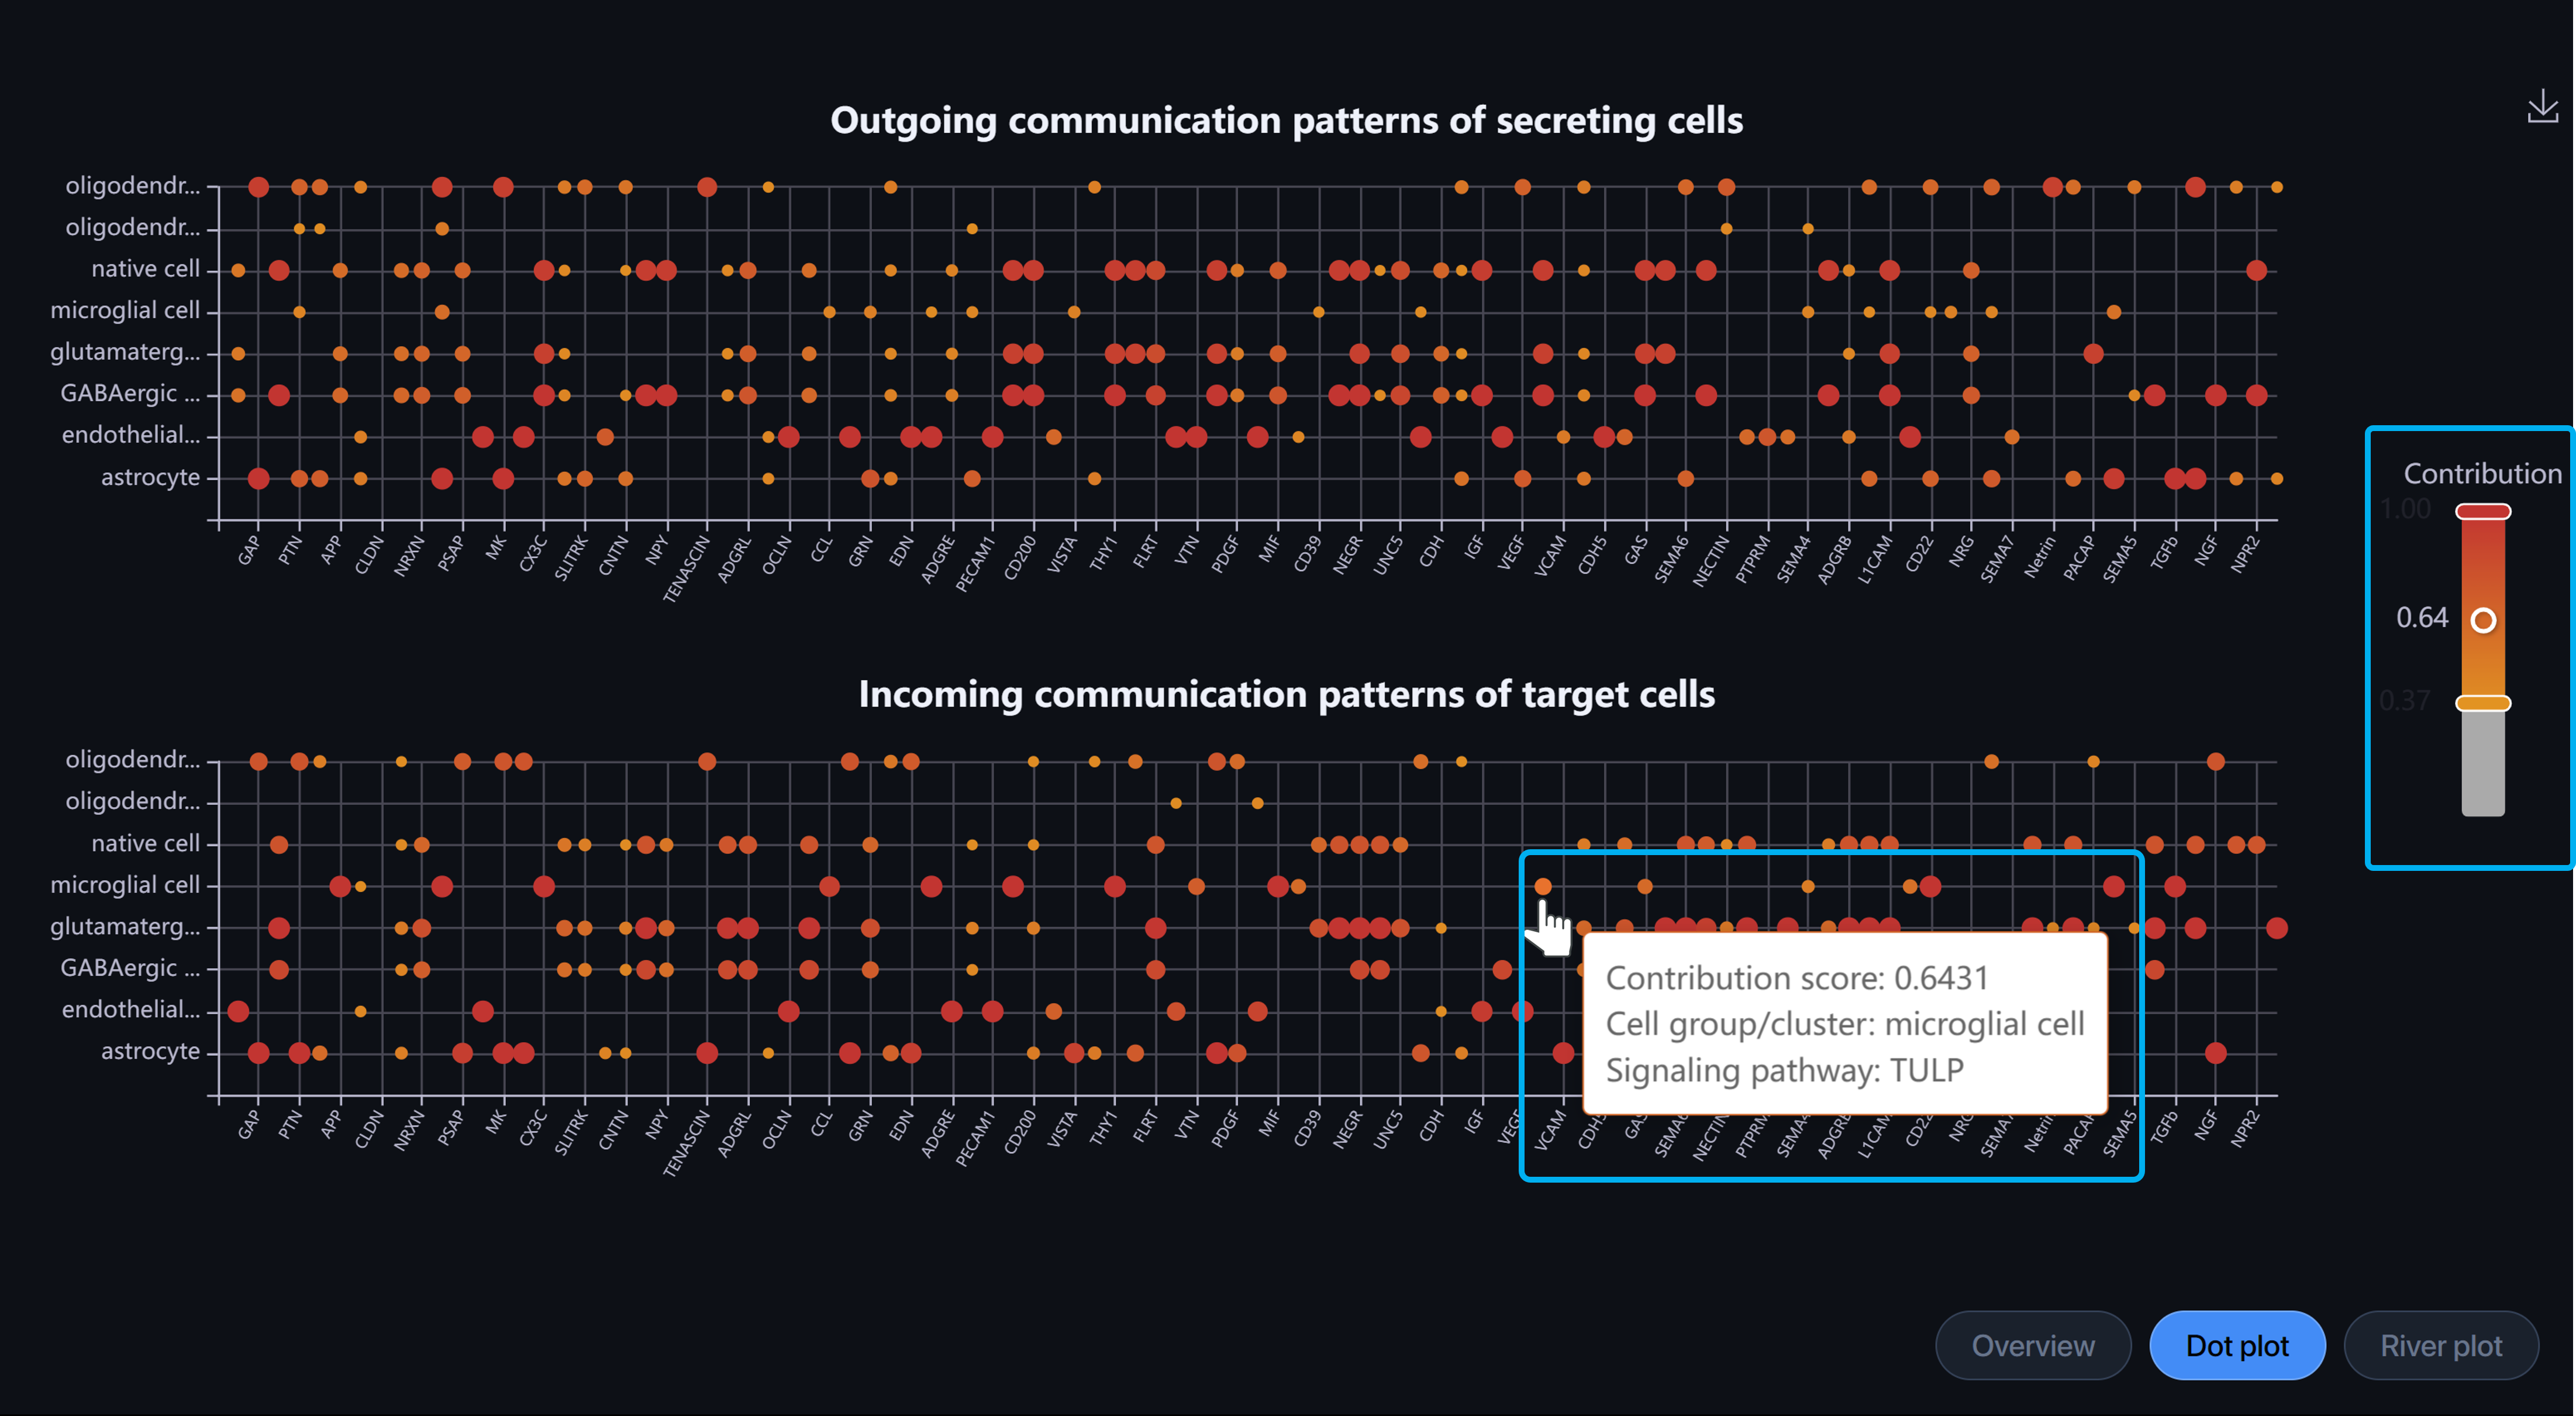
Dot plot: Outgoing communication patterns of secreting cells and Incoming communication patterns of receiving cells.
-
Y-axis: cell types
-
X-axis: pathways
-
Each dot shows the contribution score of a cell type to a signaling pathway. The higher the score, the more enriched this pathway is in the said cell type. Hover over the dot to view the information.
-
Alter the scale to filter the dots by contribution score.
-
-
River plot: Outgoing communication patterns of secreting cells and Incoming communication patterns of receiving cells.
-
Each cell type and each signaling pathway will be associated with only 1 pattern.
-
In each outgoing/incoming communication figure, on the left will be the river score showing cell types and their respective pattern.
-
On the right will be the signaling pathways and their associated pattern. Hovering over the line connecting pattern and signaling, you can see the contribution score of that signaling to its associated pattern.
-
Alter the number signaling rule to show the signaling pathway with the top contribution score.
-
You can click and drag to arrange the position of cell types, patterns, and signaling pathways.
-
