InferCNV is used to explore tumor single cell RNA-Seq data to identify evidence for somatic large-scale chromosomal copy number alterations, such as gains or deletions of entire chromosomes or large segments of chromosomes. This is done by exploring expression intensity of genes across positions of tumor genome in comparison to a set of reference 'normal' cells. A heatmap is generated illustrating the relative expression intensities across each chromosome, and it often becomes readily apparent as to which regions of the tumor genome are over-abundant or less-abundant as compared to that of normal cells.
**Infercnvpy** is a scalable python library to infer copy number variation (CNV) events from single cell transcriptomics data. It is heavliy inspired by InferCNV, but plays nicely with scanpy and is much more scalable.
The recent development of single-cell RNA-sequencing (scRNA-seq) technology has enabled us to infer cell-type-specific co-expression networks, enhancing our understanding of cell-type-specific biological functions. However, existing methods proposed for this task still face challenges due to unique characteristics in scRNA-seq data, such as high sequencing depth variations across cells and measurement errors.
CS-CORE (Su, C., Xu, Z., Shan, X. et al., 2023), an R package for cell-type-specific co-expression inference, explicitly models sequencing depth variations and measurement errors in scRNA-seq data.
In this notebook, we will illustrate an example workflow of CS-CORE using a dataset of Peripheral Blood Mononuclear Cells (PBMC) from COVID patients and healthy controls (Wilk et al., 2020). The notebook content is inspired by CS-CORE's vignette and modified to demonstrate how the tool works on BioTuring's platform.
Computational methods that model how the gene expression of a cell is influenced by interacting cells are lacking.
We present NicheNet, a method that predicts ligand–target links between interacting cells by combining their expression data with prior knowledge of signaling and gene regulatory networks.
We applied NicheNet to the tumor and immune cell microenvironment data and demonstrated that NicheNet can infer active ligands and their gene regulatory effects on interacting cells.
Recent technological advancements have enabled spatially resolved transcriptomic profiling but at multi-cellular pixel resolution, thereby hindering the identification of cell-type-specific spatial patterns and gene expression variation.
To address this challenge, we develop STdeconvolve as a reference-free approach to deconvolve underlying cell types comprising such multi-cellular pixel resolution spatial transcriptomics (ST) datasets. Using simulated as well as real ST datasets from diverse spatial transcriptomics technologies comprising a variety of spatial resolutions such as Spatial Transcriptomics, 10X Visium, DBiT-seq, and Slide-seq, we show that STdeconvolve can effectively recover cell-type transcriptional profiles and their proportional representation within pixels without reliance on external single-cell transcriptomics references.
**STdeconvolve** provides comparable performance to existing reference-based methods when suitable single-cell references are available, as well as potentially superior performance when suitable single-cell references are not available.
STdeconvolve is available as an open-source R software package with the source code available at https://github.com/JEFworks-Lab/STdeconvolve .
SpatialData (Marconato, Luca, et al., 2023) is a framework for processing spatial omics data, including
- spatialdata-io: load data from common spatial omics technologies into spatialdata.
- spatialdata-plot: static plotting library for spatialdata.
- napari-spatialdata: napari plugin for interactive exploration and annotation of spatial data.
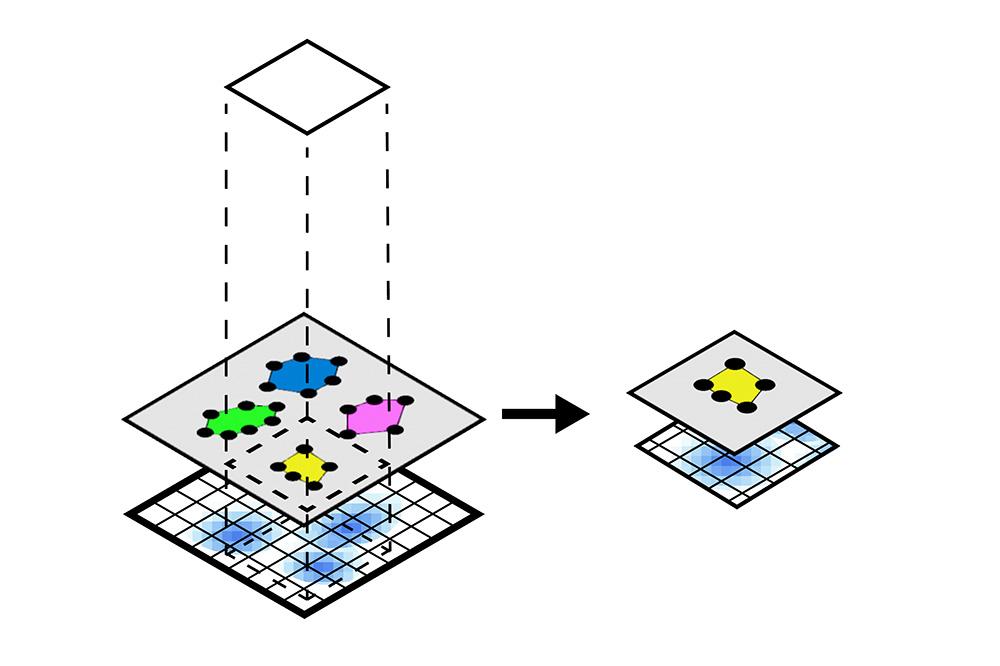
In this notebook, we will illustrate the visualization functions implemented in SpatialData for Visium data. For datasets from other spatial technologies, please check this document. Also, we will use spatial queries to retrieve all the spatial elements and instances that are within a given rectangular window or polygonal shape from an example Visium brain dataset.
The notebook content is inspired from SpatialData's vignette and modified to demonstrate how the tool works on BioTuring's platform.
SpatialData (Marconato, Luca, et al., 2023) is a framework for processing spatial omics data, including
spatialdata-io: load data from common spatial omics technologies into spatialdata.
spatialdata-plot: static plotting library for spatialdata.
napari-spatialdata: napari plugin for interactive exploration and annotation of spatial data.
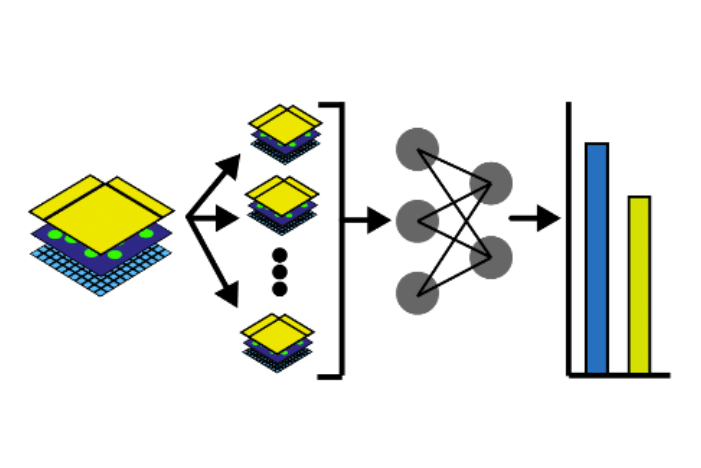
In this notebook, we will illustrate an example to train a Dense Net which predicts cell types Xenium data from an associated H&E image. Particularly, we will access and combine images and annotations across different technologies, where the H&E image from Visium data, and the cell type information from overlapping Xenium data. Also, the two modalities are spatially aligned via an affine transformation.
The notebook content is inspired from SpatialData's vignette and modified to demonstrate how the tool works on BioTuring's platform.