


Notebooks

Categories


Cells
Premium


BioTuring
Single-cell RNA sequencing (scRNA-seq) protocols often face challenges in measuring the expression of all genes within a cell due to various factors, such as technical noise, the sensitivity of scRNA-seq techniques, or sample quality. This limitation gives rise to a need for the prediction of unmeasured gene expression values (also known as dropout imputation) from scRNA-seq data.
ADImpute (Leote A, 2023) is an R package combining several dropout imputation methods, including two existing methods (DrImpute, SAVER), two novel implementations: Network, a gene regulatory network-based approach using gene-gene relationships learned from external data, and Baseline, a method corresponding to a sample-wide average..
This notebook is to illustrate an example workflow of ADImpute on sample datasets loaded from the package. The notebook content is inspired from ADImpute's vignette and modified to demonstrate how the tool works on BioTuring's platform.
BioTuring
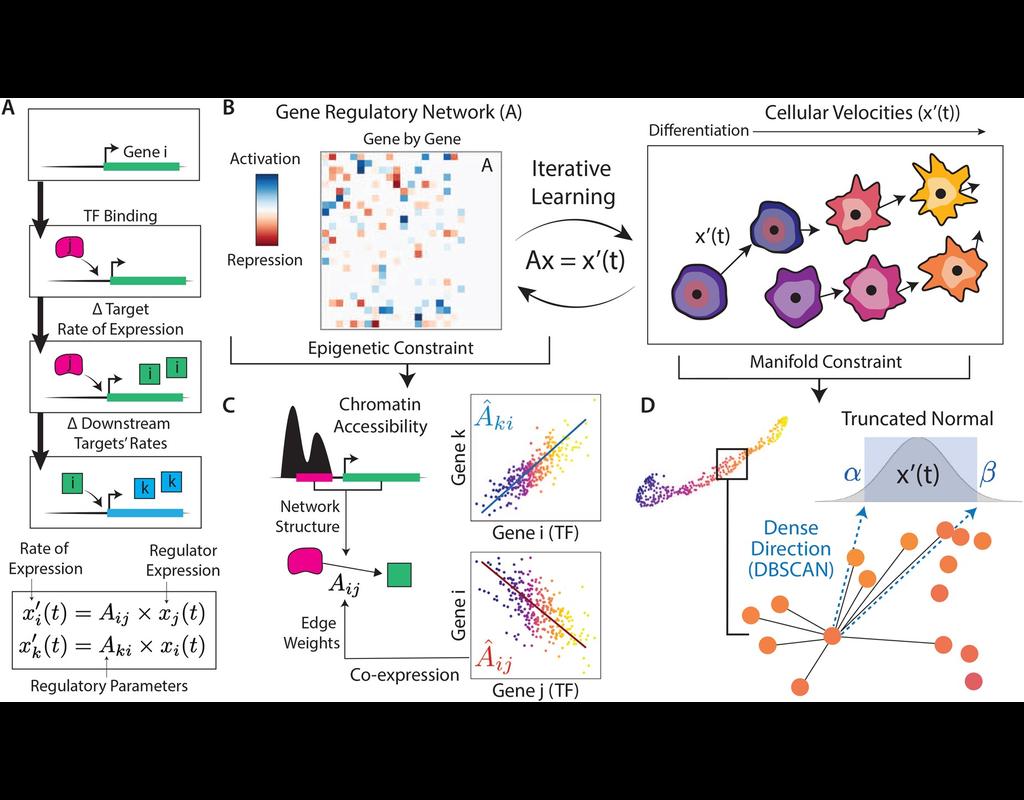
In the realm of transcriptional dynamics, understanding the intricate interplay of regulatory proteins is crucial for deciphering processes ranging from normal development to disease progression. However, traditional RNA velocity methods often overlook the underlying regulatory drivers of gene expression changes over time. This gap in knowledge hinders our ability to unravel the mechanistic intricacies of these dynamic processes.
scKINETICs (Key regulatory Interaction NETwork for Inferring Cell Speed) (Burdziak et al, 2023) offers a dynamic model for gene expression changes that simultaneously learns per-cell transcriptional velocities and a governing gene regulatory network. By employing an expectation-maximization approach, scKINETICS quantifies the impact of each regulatory element on its target genes, incorporating insights from epigenetic data, gene-gene coexpression patterns and constraints dictated by the phenotypic manifold.

BioTuring
Spatially resolved gene expression profiles are key to understand tissue organization and function. However, spatial transcriptomics (ST) profiling techniques lack single-cell resolution and require a combination with single-cell RNA sequencing (scRNA-seq) information to deconvolute the spatially indexed datasets.
Leveraging the strengths of both data types, we developed SPOTlight, a computational tool that enables the integration of ST with scRNA-seq data to infer the location of cell types and states within a complex tissue. SPOTlight is centered around a seeded non-negative matrix factorization (NMF) regression, initialized using cell-type marker genes and non-negative least squares (NNLS) to subsequently deconvolute ST capture locations (spots).
Simulating varying reference quantities and qualities, we confirmed high prediction accuracy also with shallowly sequenced or small-sized scRNA-seq reference datasets. SPOTlight deconvolution of the mouse brain correctly mapped subtle neuronal cell states of the cortical layers and the defined architecture of the hippocampus. In human pancreatic cancer, we successfully segmented patient sections and further fine-mapped normal and neoplastic cell states.
Trained on an external single-cell pancreatic tumor references, we further charted the localization of clinical-relevant and tumor-specific immune cell states, an illustrative example of its flexible application spectrum and future potential in digital pathology.
BioTuring
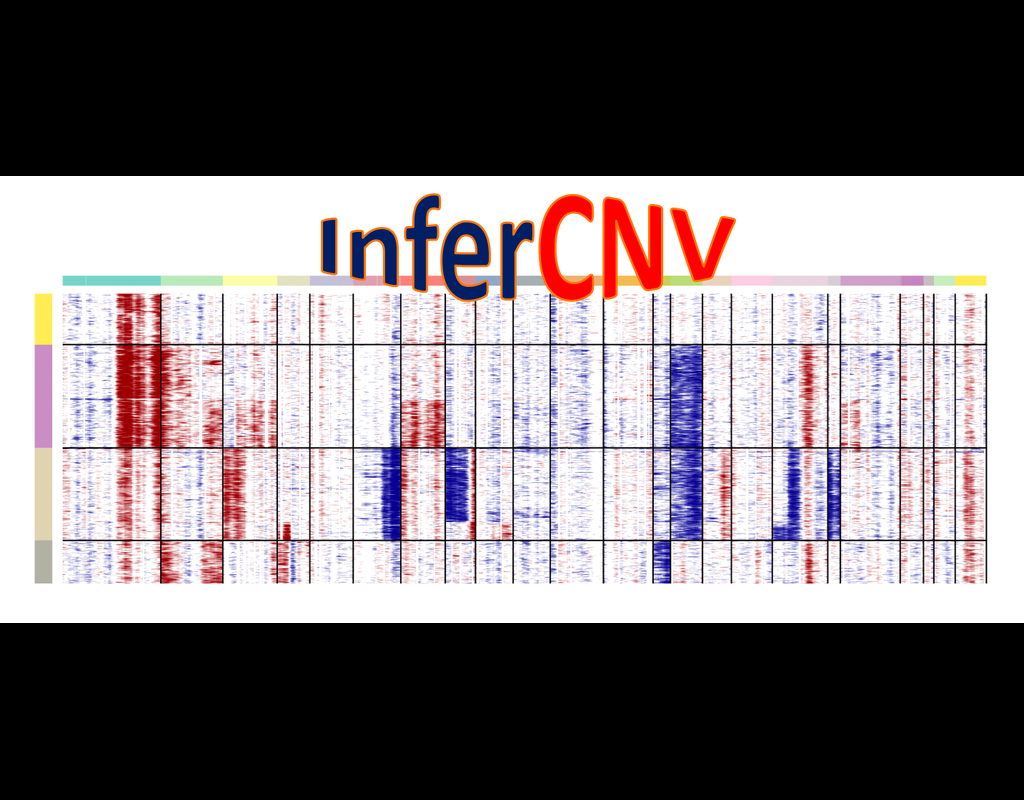
InferCNV is used to explore tumor single cell RNA-Seq data to identify evidence for somatic large-scale chromosomal copy number alterations, such as gains or deletions of entire chromosomes or large segments of chromosomes. This is done by exploring expression intensity of genes across positions of tumor genome in comparison to a set of reference 'normal' cells. A heatmap is generated illustrating the relative expression intensities across each chromosome, and it often becomes readily apparent as to which regions of the tumor genome are over-abundant or less-abundant as compared to that of normal cells.
**Infercnvpy** is a scalable python library to infer copy number variation (CNV) events from single cell transcriptomics data. It is heavliy inspired by InferCNV, but plays nicely with scanpy and is much more scalable.
Trends
BioTuring
SpatialData (Marconato, Luca, et al., 2023) is a framework for processing spatial omics data, including
- spatialdata-io: load data from common spatial omics technologies into spatialdata.
- spatialdata-plot: static plotting library for spatialdata.
- napari-spatialdata: napari plugin for interactive exploration and annotation of spatial data.
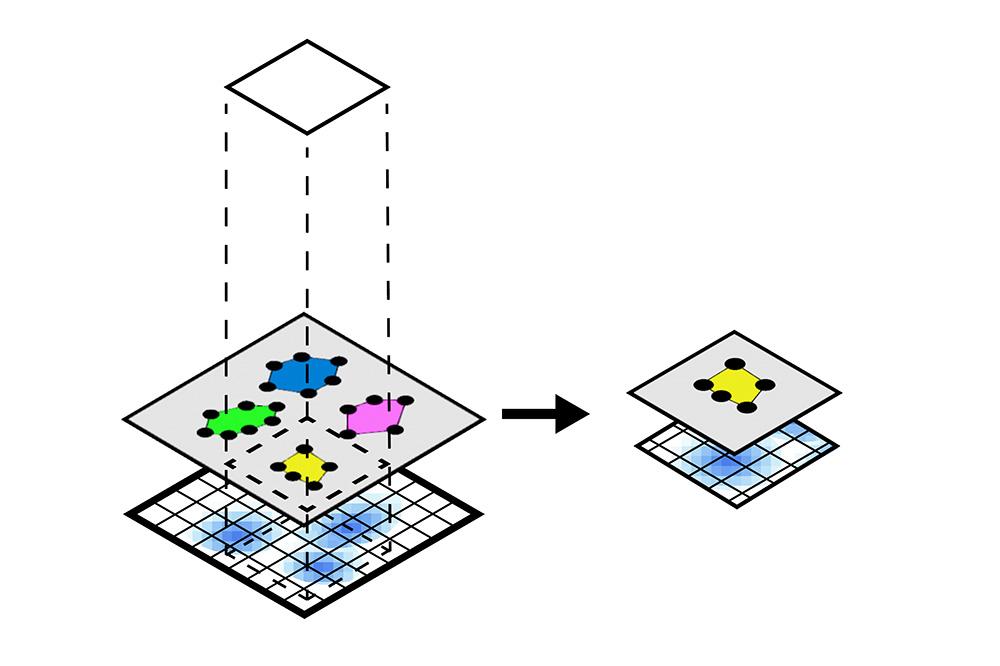
In this notebook, we will illustrate the visualization functions implemented in SpatialData for Visium data. For datasets from other spatial technologies, please check this document. Also, we will use spatial queries to retrieve all the spatial elements and instances that are within a given rectangular window or polygonal shape from an example Visium brain dataset.
The notebook content is inspired from SpatialData's vignette and modified to demonstrate how the tool works on BioTuring's platform.
BioTuring
SpatialData (Marconato, Luca, et al., 2023) is a framework for processing spatial omics data, including
spatialdata-io: load data from common spatial omics technologies into spatialdata.
spatialdata-plot: static plotting library for spatialdata.
napari-spatialdata: napari plugin for interactive exploration and annotation of spatial data.
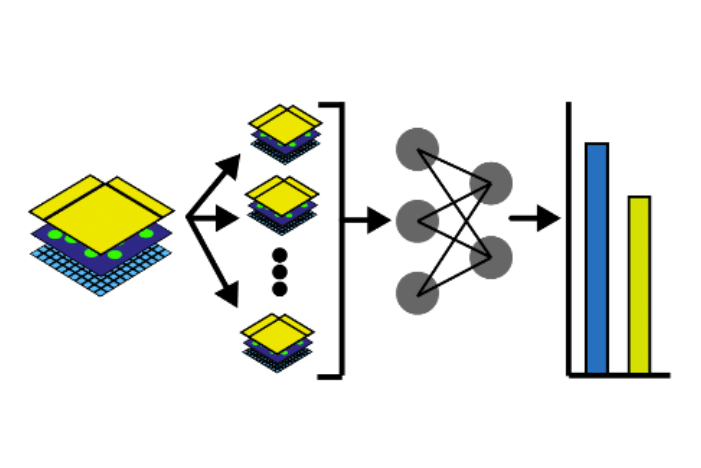
In this notebook, we will illustrate an example to train a Dense Net which predicts cell types Xenium data from an associated H&E image. Particularly, we will access and combine images and annotations across different technologies, where the H&E image from Visium data, and the cell type information from overlapping Xenium data. Also, the two modalities are spatially aligned via an affine transformation.
The notebook content is inspired from SpatialData's vignette and modified to demonstrate how the tool works on BioTuring's platform.