


Notebooks

Categories


Cells
Premium


BioTuring
In this notebook, we present COMMOT (COMMunication analysis by Optimal Transport) to infer cell-cell communication (CCC) in spatial transcriptomic, a package that infers CCC by simultaneously considering numerous ligand–receptor pairs for either spatial transcriptomic data or spatially annotated scRNA-seq data equipped with spatial distances between cells estimated from paired spatial imaging data.
A collective optimal transport method is developed to handle complex molecular interactions and spatial constraints. Furthermore, we introduce downstream analysis tools to infer spatial signaling directionality and genes regulated by signaling using machine learning models.
BioTuring
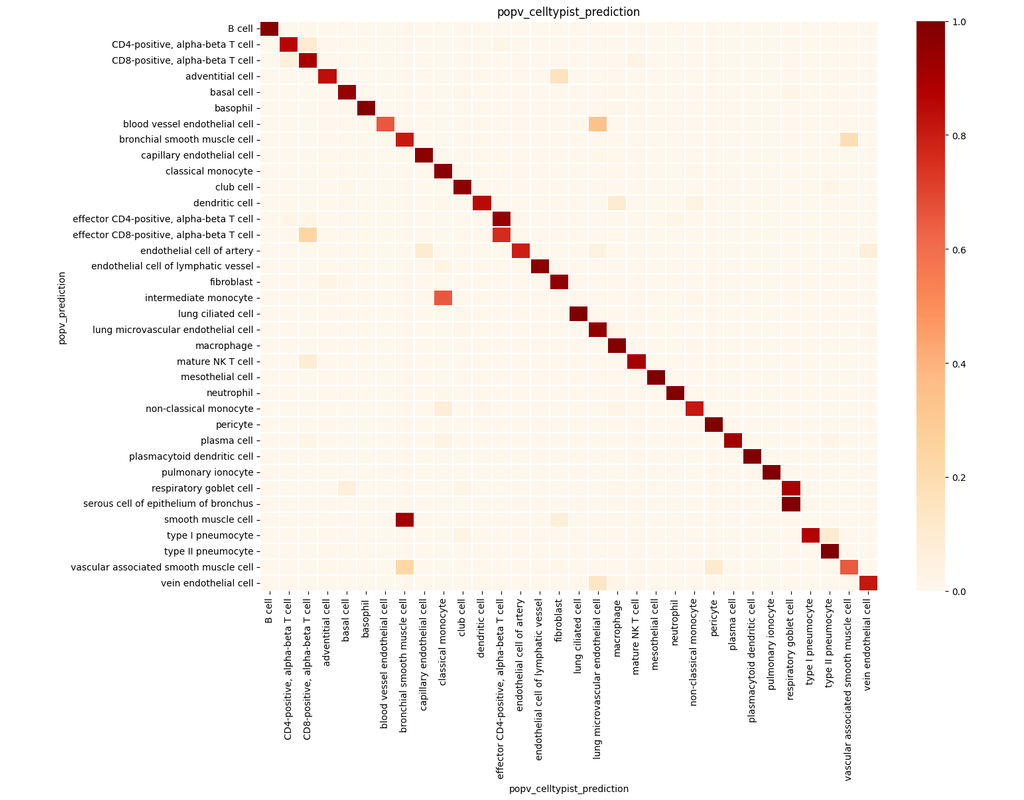
PopV uses popular vote of a variety of cell-type transfer tools to classify cell-types in a query dataset based on a test dataset.
Using this variety of algorithms, they compute the agreement between those algorithms and use this agreement to predict which cell-types have a high likelihood of the same cell-types observed in the reference.

BioTuring
Single-cell RNA-seq datasets in diverse biological and clinical conditions provide great opportunities for the full transcriptional characterization of cell types.
However, the integration of these datasets is challeging as they remain biological and techinical differences. **Harmony** is an algorithm allowing fast, sensitive and accurate single-cell data integration.

BioTuring
The recent development of experimental methods for measuring chromatin state at single-cell resolution has created a need for computational tools capable of analyzing these datasets. Here we developed Signac, a framework for the analysis of single-cell chromatin data, as an extension of the Seurat R toolkit for single-cell multimodal analysis.
**Signac** enables an end-to-end analysis of single-cell chromatin data, including peak calling, quantification, quality control, dimension reduction, clustering, integration with single-cell gene expression datasets, DNA motif analysis, and interactive visualization.
Furthermore, Signac facilitates the analysis of multimodal single-cell chromatin data, including datasets that co-assay DNA accessibility with gene expression, protein abundance, and mitochondrial genotype. We demonstrate scaling of the Signac framework to datasets containing over 700,000 cells.
Trends
BioTuring
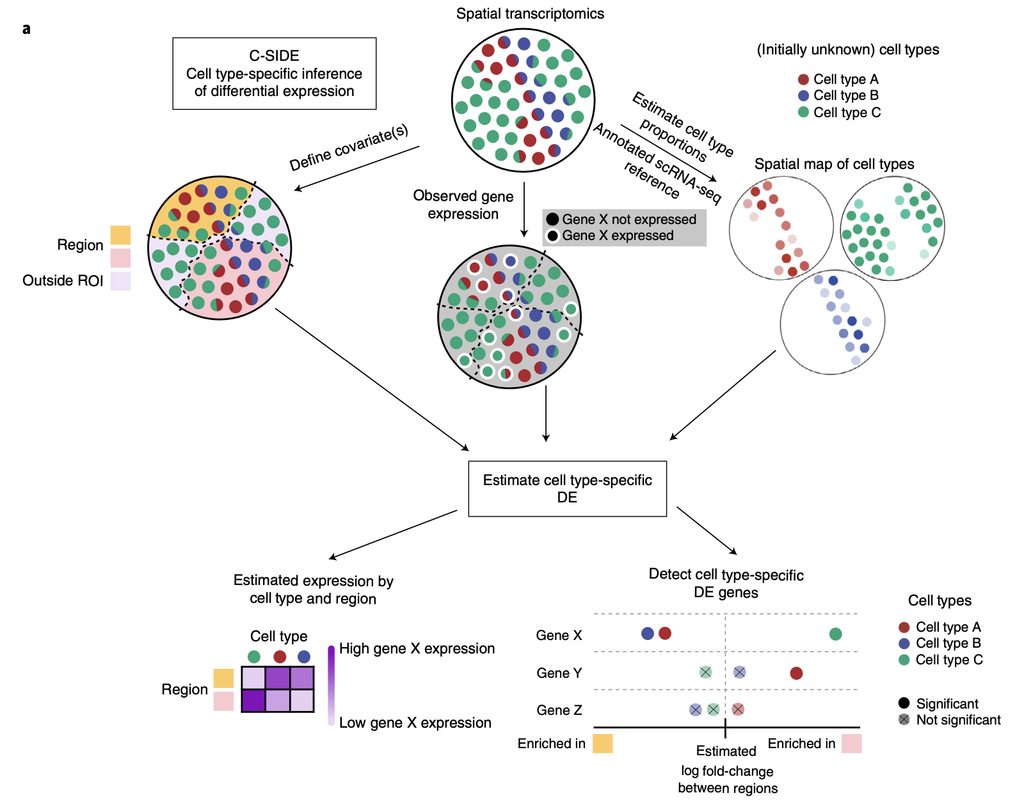
Recent spatial transcriptomics (ST) technologies have allowed us to capture cellular heterogeneity while retaining spatial information. However, ST datasets may lose single-cell resolution, limiting the discovery of cell-type-specific spatial patterns of localization and expression.
spacexr (Spatial-eXpression-R) is an R package providing two methods, i.e., Robust Cell Type Decomposition (RCTD) (Cable, Dylan M., et al., 2022) and Cell type-Specific Inference of Differential Expression (C-SIDE) (Cable, Dylan M., et al., 2022) for ST data. RCTD is proposed for cell type deconvolution, while leveraging references from another annotated single-cell RNA-seq data. C-SIDE identifies cell type-specific differential expression, accounting for localization of other cell types.
We will illustrate an example workflow in two notebooks, RCTD and C-SIDE, on a hippocampus Visium dataset provided by the authors. The notebooks are inspired from spacexr's vignettes and modified to demonstrate how the tool works on BioTuring's platform.