


Notebooks

Categories


Cells
Premium


BioTuring
The development of large-scale single-cell atlases has allowed describing cell states in a more detailed manner. Meanwhile, current deep leanring methods enable rapid analysis of newly generated query datasets by mapping them into reference atlases.
expiMap (‘explainable programmable mapper’) Lotfollahi, Mohammad, et al. is one of the methods proposed for single-cell reference mapping. Furthermore, it incorporates prior knowledge from gene sets databases or users to analyze query data in the context of known gene programs (GPs).

BioTuring
Cell–cell communication mediated by ligand–receptor complexes is critical to coordinating diverse biological processes, such as development, differentiation and inflammation.
To investigate how the context-dependent crosstalk of different cell types enables physiological processes to proceed, we developed CellPhoneDB, a novel repository of ligands, receptors and their interactions. In contrast to other repositories, our database takes into account the subunit architecture of both ligands and receptors, representing heteromeric complexes accurately.
We integrated our resource with a statistical framework that predicts enriched cellular interactions between two cell types from single-cell transcriptomics data. Here, we outline the structure and content of our repository, provide procedures for inferring cell–cell communication networks from single-cell RNA sequencing data and present a practical step-by-step guide to help implement the protocol.
CellPhoneDB v.2.0 is an updated version of our resource that incorporates additional functionalities to enable users to introduce new interacting molecules and reduces the time and resources needed to interrogate large datasets.
CellPhoneDB v.2.0 is publicly available, both as code and as a user-friendly web interface; it can be used by both experts and researchers with little experience in computational genomics.
In our protocol, we demonstrate how to evaluate meaningful biological interactions with CellPhoneDB v.2.0 using published datasets. This protocol typically takes ~2 h to complete, from installation to statistical analysis and visualization, for a dataset of ~10 GB, 10,000 cells and 19 cell types, and using five threads.

BioTuring
In this notebook, we present COMMOT (COMMunication analysis by Optimal Transport) to infer cell-cell communication (CCC) in spatial transcriptomic, a package that infers CCC by simultaneously considering numerous ligand–receptor pairs for either spatial transcriptomic data or spatially annotated scRNA-seq data equipped with spatial distances between cells estimated from paired spatial imaging data.
A collective optimal transport method is developed to handle complex molecular interactions and spatial constraints. Furthermore, we introduce downstream analysis tools to infer spatial signaling directionality and genes regulated by signaling using machine learning models.
BioTuring
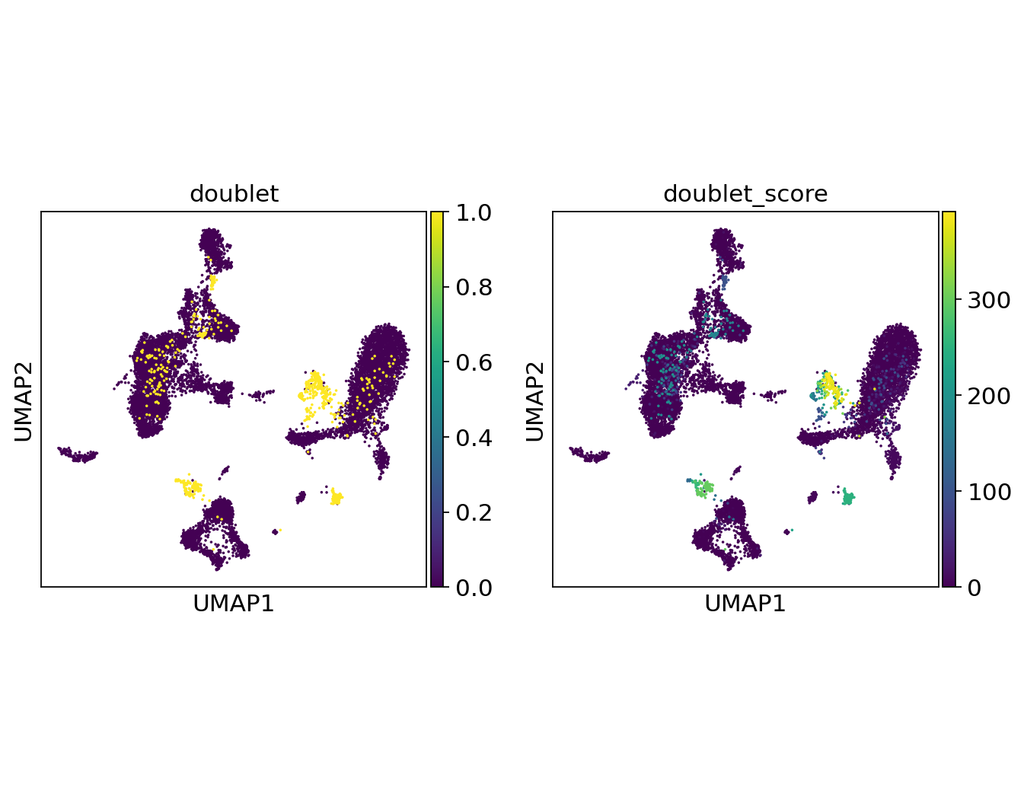
Doublets are a characteristic error source in droplet-based single-cell sequencing data where two cells are encapsulated in the same oil emulsion and are tagged with the same cell barcode. Across type doublets manifest as fictitious phenotypes that can be incorrectly interpreted as novel cell types. DoubletDetection present a novel, fast, unsupervised classifier to detect across-type doublets in single-cell RNA-sequencing data that operates on a count matrix and imposes no experimental constraints.
This classifier leverages the creation of in silico synthetic doublets to determine which cells in the
input count matrix have gene expression that is best explained by the combination of distinct cell
types in the matrix.
In this notebook, we will illustrate an example workflow for detecting doublets in single-cell RNA-seq count matrices.
Trends

BioTuring
Computational methods that model how the gene expression of a cell is influenced by interacting cells are lacking.
We present NicheNet, a method that predicts ligand–target links between interacting cells by combining their expression data with prior knowledge of signaling and gene regulatory networks.
We applied NicheNet to the tumor and immune cell microenvironment data and demonstrated that NicheNet can infer active ligands and their gene regulatory effects on interacting cells.