


Notebooks

Categories


Cells
Notebook
Premium

BioTuring
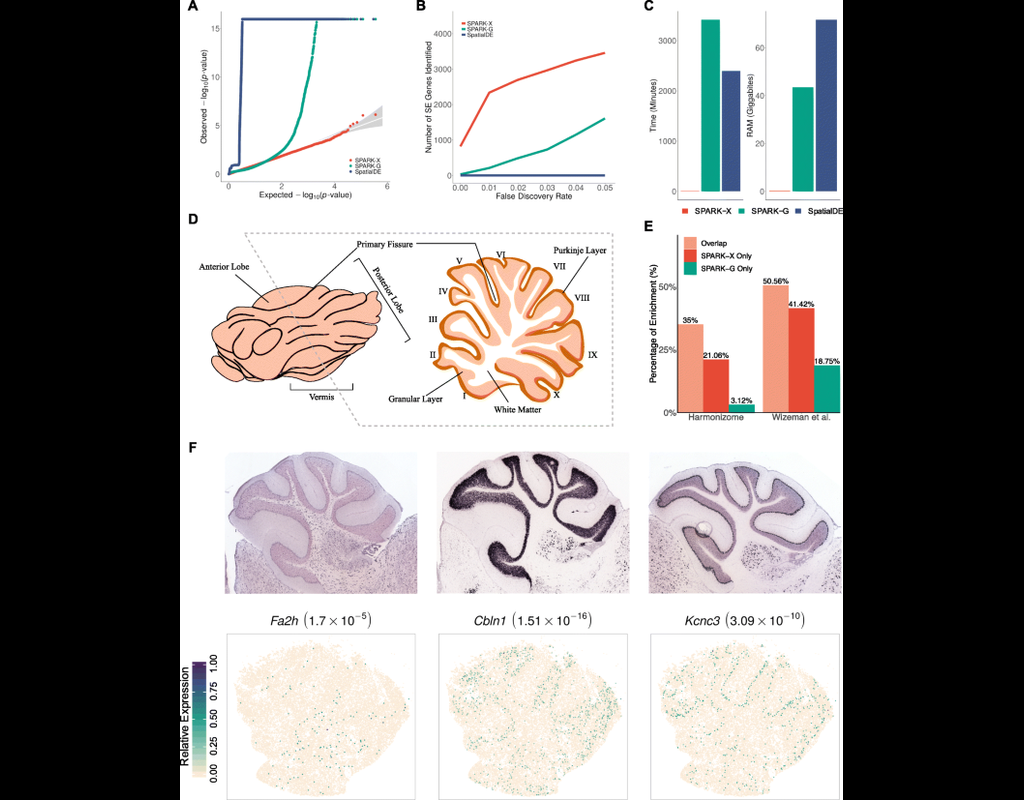
Spatial transcriptomic studies are becoming increasingly common and large, posing important statistical and computational challenges for many analytic tasks. Here, we present SPARK-X, a non-parametric method for rapid and effective detection of spatially expressed genes in large spatial transcriptomic studies.
SPARK-X not only produces effective type I error control and high power but also brings orders of magnitude computational savings. We apply SPARK-X to analyze three large datasets, one of which is only analyzable by SPARK-X. In these data, SPARK-X identifies many spatially expressed genes including those that are spatially expressed within the same cell type, revealing new biological insights.

BioTuring
In this notebook, we present COMMOT (COMMunication analysis by Optimal Transport) to infer cell-cell communication (CCC) in spatial transcriptomic, a package that infers CCC by simultaneously considering numerous ligand–receptor pairs for either spatial transcriptomic data or spatially annotated scRNA-seq data equipped with spatial distances between cells estimated from paired spatial imaging data.
A collective optimal transport method is developed to handle complex molecular interactions and spatial constraints. Furthermore, we introduce downstream analysis tools to infer spatial signaling directionality and genes regulated by signaling using machine learning models.
BioTuring
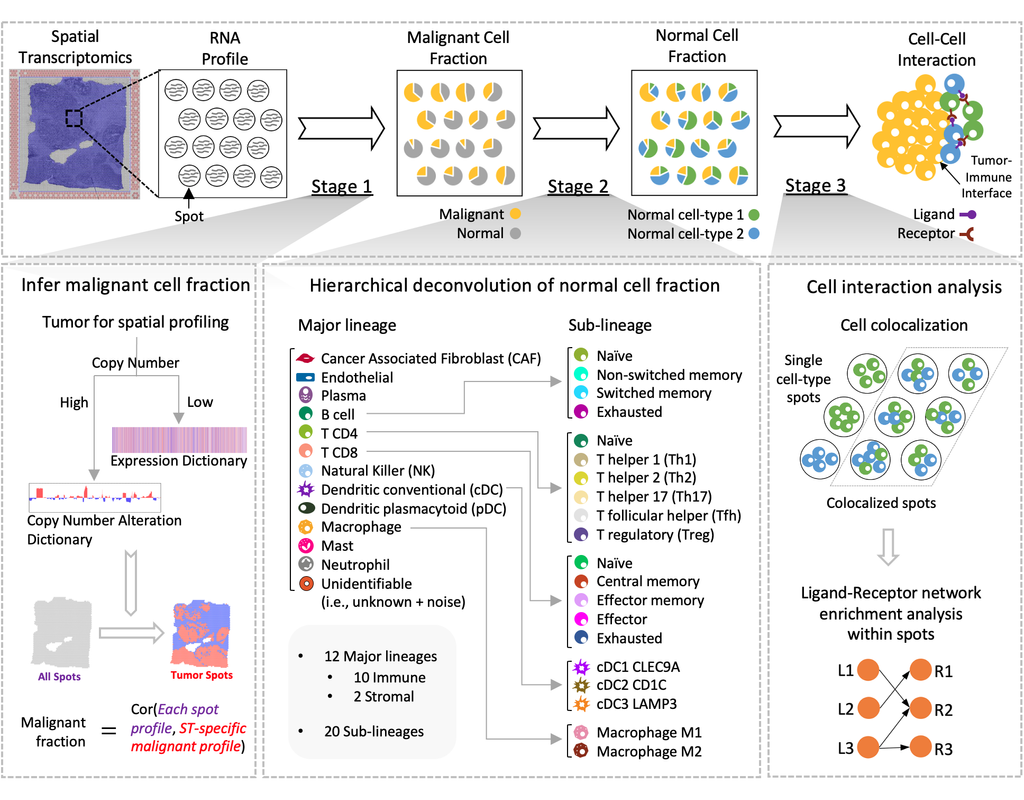
Spatial transcriptomics (ST) technology has allowed to capture of topographical gene expression profiling of tumor tissues, but single-cell resolution is potentially lost. Identifying cell identities in ST datasets from tumors or other samples remains challenging for existing cell-type deconvolution methods.
Spatial Cellular Estimator for Tumors (SpaCET) is an R package for analyzing cancer ST datasets to estimate cell lineages and intercellular interactions in the tumor microenvironment. Generally, SpaCET infers the malignant cell fraction through a gene pattern dictionary, then calibrates local cell densities and determines immune and stromal cell lineage fractions using a constrained regression model. Finally, the method can reveal putative cell-cell interactions in the tumor microenvironment.
In this notebook, we will illustrate an example workflow for cell type deconvolution and interaction analysis on breast cancer ST data from 10X Visium. The notebook is inspired by SpaCET's vignettes and modified to demonstrate how the tool works on BioTuring's platform.
BioTuring
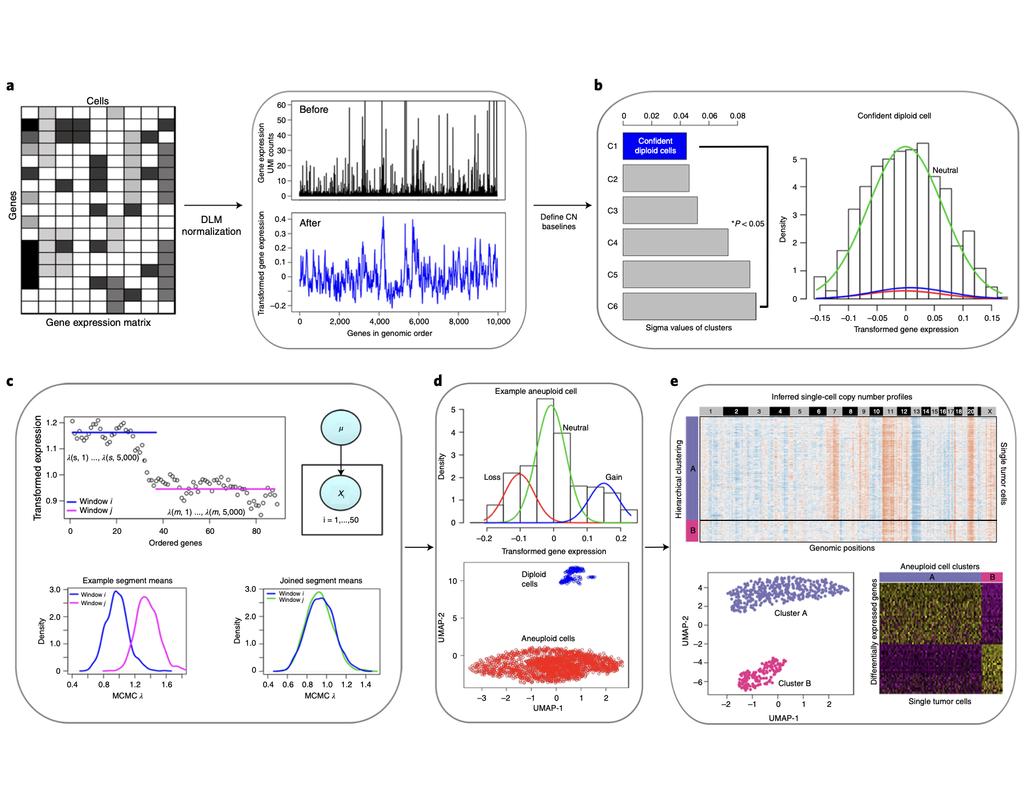
Classification of tumor and normal cells in the tumor microenvironment from scRNA-seq data is an ongoing challenge in human cancer study.
Copy number karyotyping of aneuploid tumors (***copyKAT***) (Gao, Ruli, et al., 2021) is a method proposed for identifying copy number variations in single-cell transcriptomics data. It is used to predict aneuploid tumor cells and delineate the clonal substructure of different subpopulations that coexist within the tumor mass.
In this notebook, we will illustrate a basic workflow of CopyKAT based on the tutorial provided on CopyKAT's repository. We will use a dataset of triple negative cancer tumors sequenced by 10X Chromium 3'-scRNAseq (GSM4476486) as an example. The dataset contains 20,990 features across 1,097 cells. We have modified the notebook to demonstrate how the tool works on BioTuring's platform.