E-spatial

Beta

New application is live now

E-spatial

Single-cell spatial explorer

Notebooks

Premium

Multimodal single-cell chromatin analysis with Signac
lock icon

BioTuring

The recent development of experimental methods for measuring chromatin state at single-cell resolution has created a need for computational tools capable of analyzing these datasets. Here we developed Signac, a framework for the analysis of single-cell chromatin data, as an extension of the Seurat R toolkit for single-cell multimodal analysis. **Signac** enables an end-to-end analysis of single-cell chromatin data, including peak calling, quantification, quality control, dimension reduction, clustering, integration with single-cell gene expression datasets, DNA motif analysis, and interactive visualization. Furthermore, Signac facilitates the analysis of multimodal single-cell chromatin data, including datasets that co-assay DNA accessibility with gene expression, protein abundance, and mitochondrial genotype. We demonstrate scaling of the Signac framework to datasets containing over 700,000 cells.
Only CPU
Required PFP
signac
expiMap: Biologically informed deep learning to query gene programs in single-cell atlases
lock icon

BioTuring

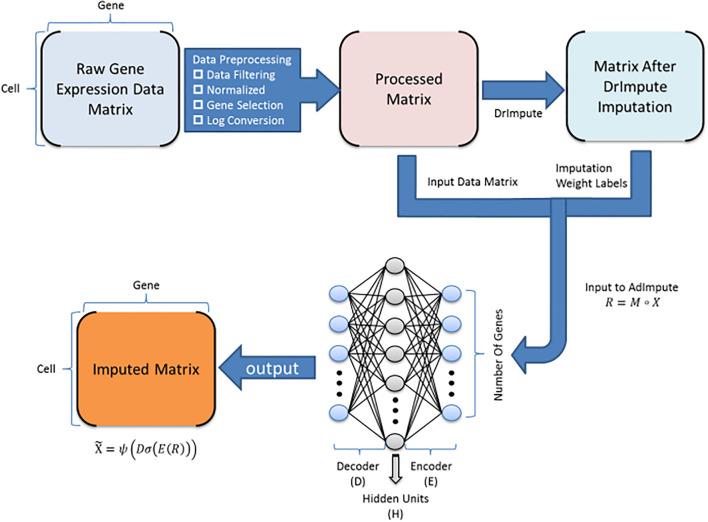
The development of large-scale single-cell atlases has allowed describing cell states in a more detailed manner. Meanwhile, current deep leanring methods enable rapid analysis of newly generated query datasets by mapping them into reference atlases. expiMap (‘explainable programmable mapper’) Lotfollahi, Mohammad, et al. is one of the methods proposed for single-cell reference mapping. Furthermore, it incorporates prior knowledge from gene sets databases or users to analyze query data in the context of known gene programs (GPs).
Required GPU
expiMap
Monocle3 - An analysis toolkit for single-cell RNA-seq
lock icon

BioTuring

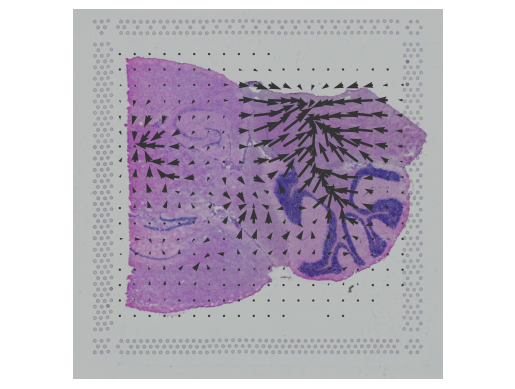
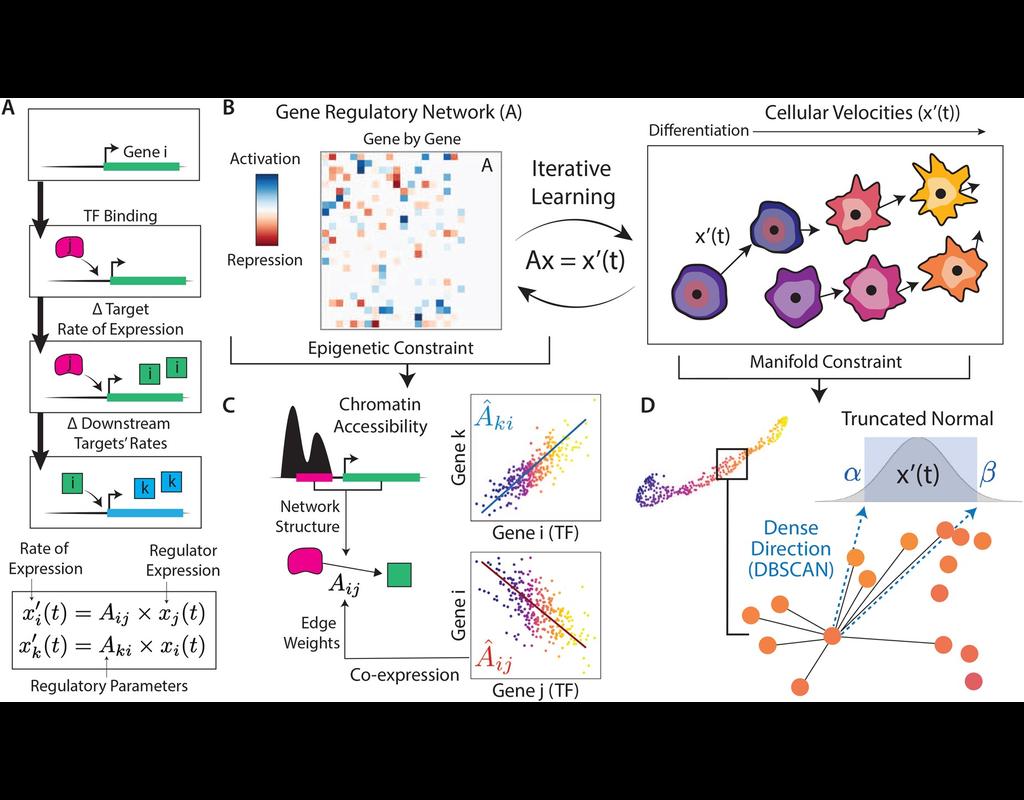
Build single-cell trajectories with the software that introduced **pseudotime**. Find out about cell fate decisions and the genes regulated as they're made. Group and classify your cells based on gene expression. Identify new cell types and states and the genes that distinguish them. Find genes that vary between cell types and states, over trajectories, or in response to perturbations using statistically robust, flexible differential analysis. In development, disease, and throughout life, cells transition from one state to another. Monocle introduced the concept of **pseudotime**, which is a measure of how far a cell has moved through biological progress. Many researchers are using single-cell RNA-Seq to discover new cell types. Monocle 3 can help you purify them or characterize them further by identifying key marker genes that you can use in follow-up experiments such as immunofluorescence or flow sorting. **Single-cell trajectory analysis** shows how cells choose between one of several possible end states. The new reconstruction algorithms introduced in Monocle 3 can robustly reveal branching trajectories, along with the genes that cells use to navigate these decisions.
A workflow to analyze cell-cell communications on Visium data
lock icon

BioTuring

Single-cell RNA data allows cell-cell communications (***CCC***) methods to infer CCC at either the individual cell or cell cluster/cell type level, but physical distances between cells are not preserved Almet, Axel A., et al., (2021). On the other hand, spatial data provides spatial distances between cells, but single-cell or gene resolution is potentially lost. Therefore, integrating two types of data in a proper manner can complement their strengths and limitations, from that improve CCC analysis. In this pipeline, we analyze CCC on Visium data with single-cell data as a reference. The pipeline includes 4 sub-notebooks as following 01-deconvolution: This step involves deconvolution and cell type annotation for Visium data, with cell type information obtained from a relevant single-cell dataset. The deconvolution method is SpatialDWLS which is integrated in Giotto package. 02-giotto: performs spatial based CCC and expression based CCC on Visium data using Giotto method. 03-nichenet: performs spatial based CCC and expression based CCC on Visium data using NicheNet method. 04-visualization: visualizes CCC results obtained from Giotto and NicheNet.

Trends

WGCNA: an R package for Weighted Gene Correlation Network Analysis

BioTuring

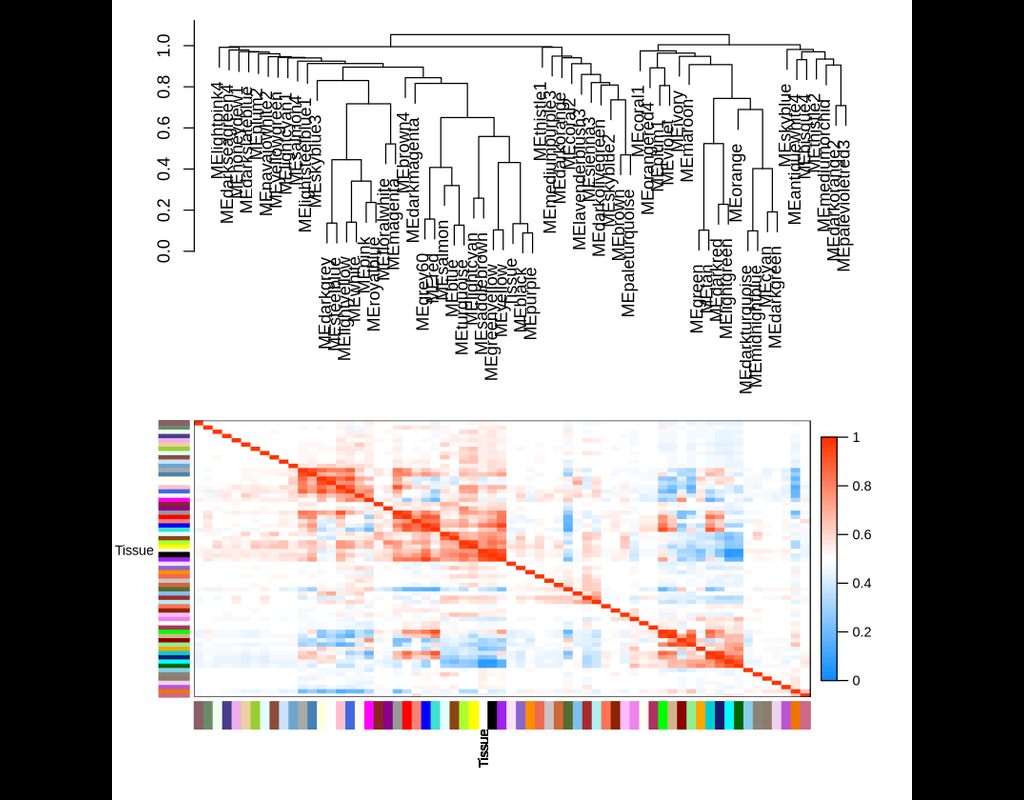
WGCNA: an R package for Weighted Gene Correlation Network Analysis Correlation networks are increasingly being used in bioinformatics applications. For example, weighted gene co-expression network analysis is a systems biology method for describing the correlation patterns among genes across microarray samples. Weighted correlation network analysis (WGCNA) can be used for: - Finding clusters (modules) of highly correlated genes - Summarizing such clusters using the module eigengene or an intramodular hub gene - Relating modules to one another and to external sample traits (using eigengene network methodology) - For calculating module membership measures All of these are important for identifying potential candidate genes associated with measured traits as well as identifying genes that are consistently co-expressed and could be contributing to similar molecular pathways. Using WGCNA is also extremely useful statistically as it accounts for inter-individual variation in gene expression and alleviates issues associated with multiple testing.
Only CPU
WGCNA