


Notebooks

Categories


Cells
Premium

BioTuring
scVI-tools (single-cell variational inference tools) is a package for end-to-end analysis of single-cell omics data primarily developed and maintained by the Yosef Lab at UC Berkeley. scvi-tools has two components
- Interface for easy use of a range of probabilistic models for single-cell omics (e.g., scVI, scANVI, totalVI).
- Tools to build new probabilistic models, which are powered by PyTorch, PyTorch Lightning, and Pyro.

BioTuring
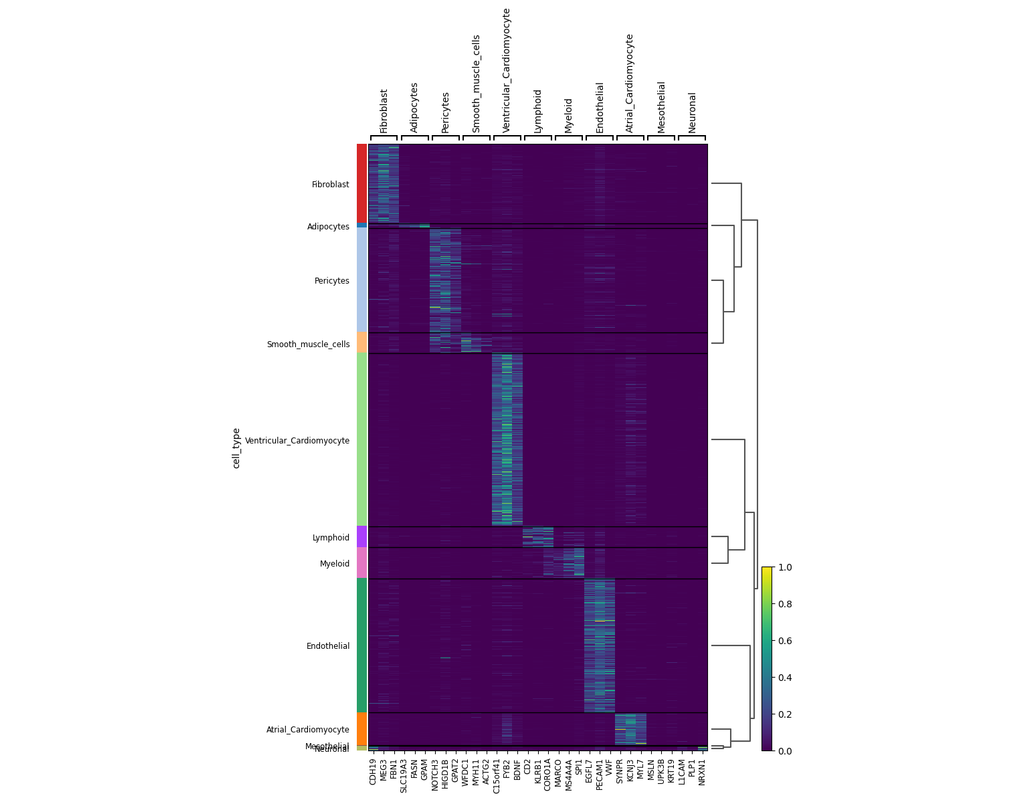
Charting an organs’ biological atlas requires us to spatially resolve the entire single-cell transcriptome, and to relate such cellular features to the anatomical scale. Single-cell and single-nucleus RNA-seq (sc/snRNA-seq) can profile cells comprehensively, but lose spatial information.
Spatial transcriptomics allows for spatial measurements, but at lower resolution and with limited sensitivity. Targeted in situ technologies solve both issues, but are limited in gene throughput. To overcome these limitations we present Tangram, a method that aligns sc/snRNA-seq data to various forms of spatial data collected from the same region, including MERFISH, STARmap, smFISH, Spatial Transcriptomics (Visium) and histological images.
**Tangram** can map any type of sc/snRNA-seq data, including multimodal data such as those from SHARE-seq, which we used to reveal spatial patterns of chromatin accessibility. We demonstrate Tangram on healthy mouse brain tissue, by reconstructing a genome-wide anatomically integrated spatial map at single-cell resolution of the visual and somatomotor areas.
BioTuring
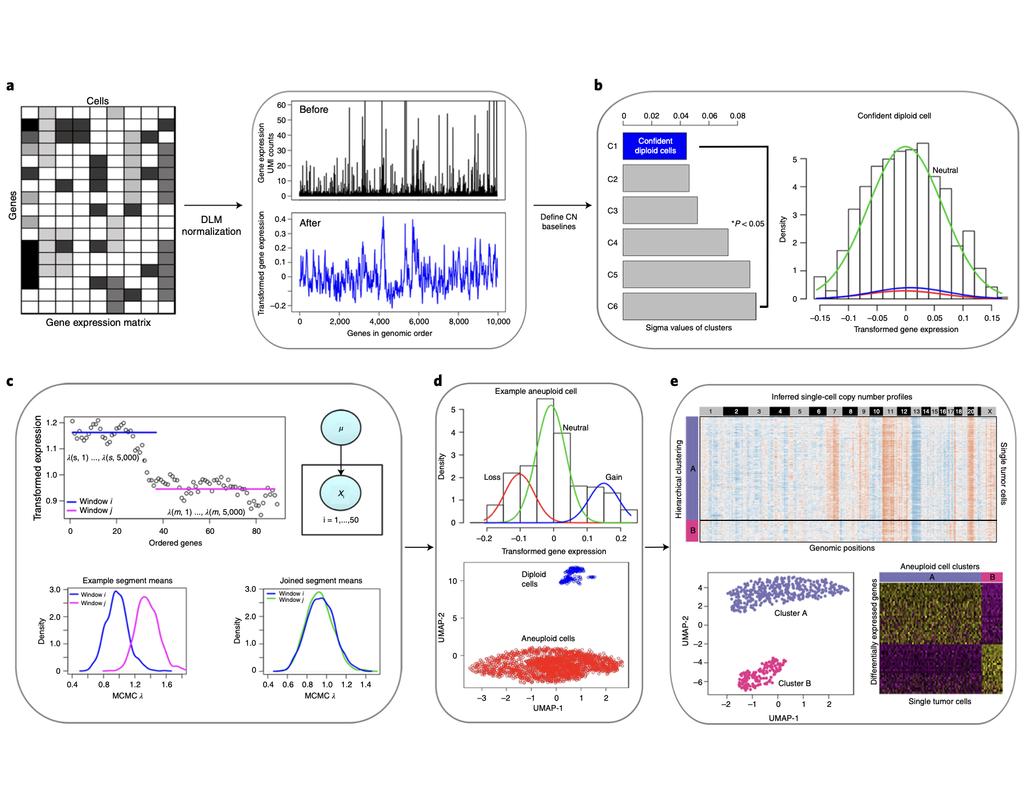
Classification of tumor and normal cells in the tumor microenvironment from scRNA-seq data is an ongoing challenge in human cancer study.
Copy number karyotyping of aneuploid tumors (***copyKAT***) (Gao, Ruli, et al., 2021) is a method proposed for identifying copy number variations in single-cell transcriptomics data. It is used to predict aneuploid tumor cells and delineate the clonal substructure of different subpopulations that coexist within the tumor mass.
In this notebook, we will illustrate a basic workflow of CopyKAT based on the tutorial provided on CopyKAT's repository. We will use a dataset of triple negative cancer tumors sequenced by 10X Chromium 3'-scRNAseq (GSM4476486) as an example. The dataset contains 20,990 features across 1,097 cells. We have modified the notebook to demonstrate how the tool works on BioTuring's platform.
BioTuring
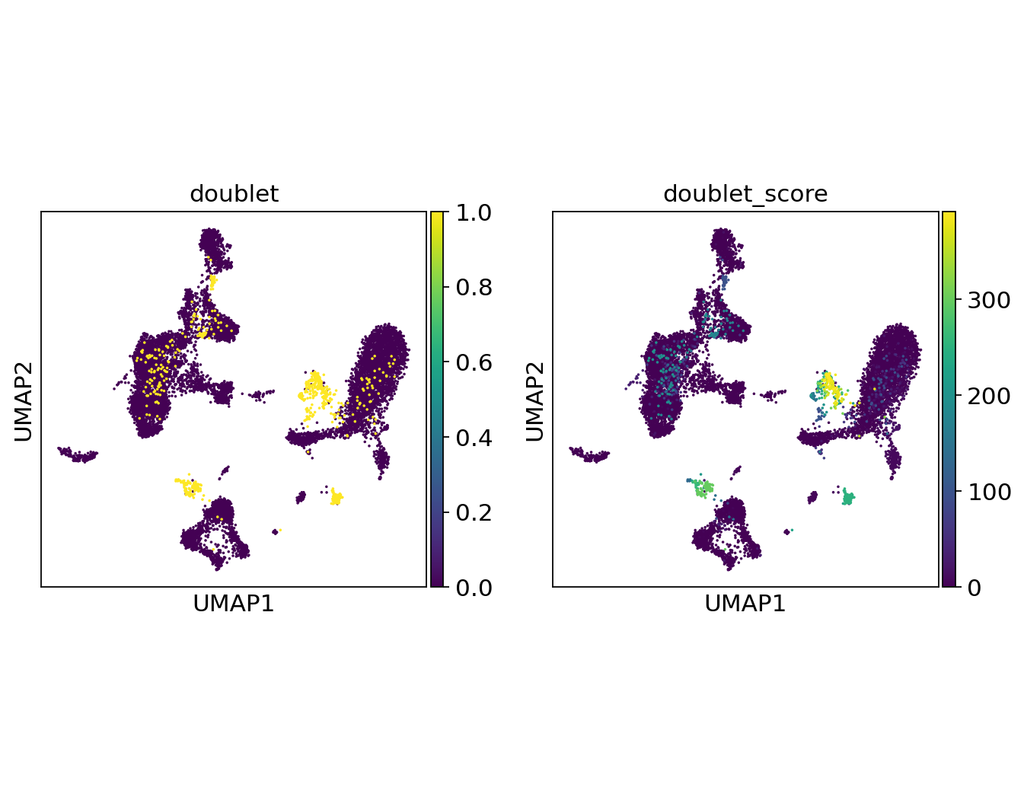
Doublets are a characteristic error source in droplet-based single-cell sequencing data where two cells are encapsulated in the same oil emulsion and are tagged with the same cell barcode. Across type doublets manifest as fictitious phenotypes that can be incorrectly interpreted as novel cell types. DoubletDetection present a novel, fast, unsupervised classifier to detect across-type doublets in single-cell RNA-sequencing data that operates on a count matrix and imposes no experimental constraints.
This classifier leverages the creation of in silico synthetic doublets to determine which cells in the
input count matrix have gene expression that is best explained by the combination of distinct cell
types in the matrix.
In this notebook, we will illustrate an example workflow for detecting doublets in single-cell RNA-seq count matrices.
Trends
BioTuring
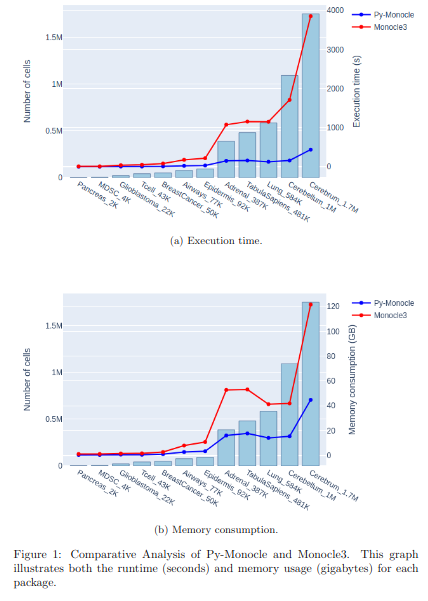
BioTuring Py-Monocle is a package tailored for computing pseudotime on large single-cell datasets. Implemented in Python and drawing inspiration from the Monocle3 package in R, our approach optimizes select steps for enhanced performance efficiency. Leveraging established Python libraries such as Numpy, and Scipy, this algorithm offers an economical solution for analyzing single-cell datasets.