


Notebooks

Categories


Cells
Premium

BioTuring
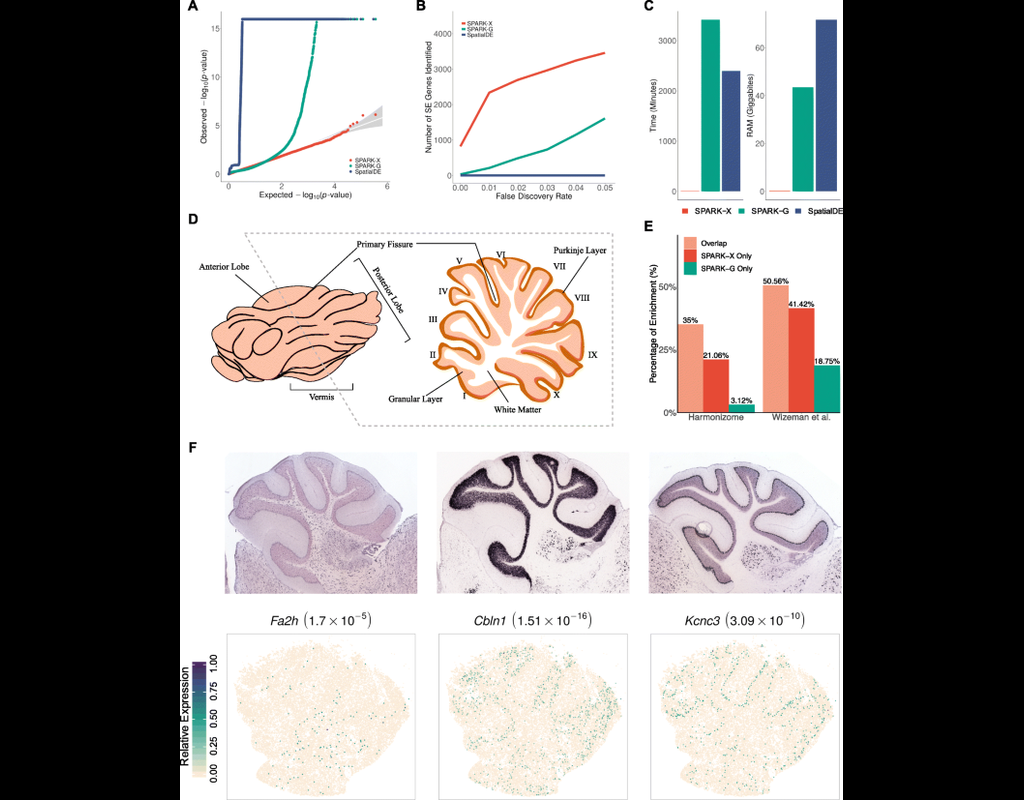
Spatial transcriptomic studies are becoming increasingly common and large, posing important statistical and computational challenges for many analytic tasks. Here, we present SPARK-X, a non-parametric method for rapid and effective detection of spatially expressed genes in large spatial transcriptomic studies.
SPARK-X not only produces effective type I error control and high power but also brings orders of magnitude computational savings. We apply SPARK-X to analyze three large datasets, one of which is only analyzable by SPARK-X. In these data, SPARK-X identifies many spatially expressed genes including those that are spatially expressed within the same cell type, revealing new biological insights.

BioTuring
Single-cell RNA sequencing (scRNA-seq) data have allowed us to investigate cellular heterogeneity and the kinetics of a biological process. Some studies need to understand how cells change state, and corresponding genes during the process, but it is challenging to track the cell development in scRNA-seq protocols. Therefore, a variety of statistical and computational methods have been proposed for lineage inference (or pseudotemporal ordering) to reconstruct the states of cells according to the developmental process from the measured snapshot data. Specifically, lineage refers to an ordered transition of cellular states, where individual cells represent points along. pseudotime is a one-dimensional variable representing each cell’s transcriptional progression toward the terminal state.
Slingshot which is one of the methods suggested for lineage reconstruction and pseudotime inference from single-cell gene expression data. In this notebook, we will illustrate an example workflow for cell lineage and pseudotime inference using Slingshot. The notebook is inspired by Slingshot's vignette and modified to demonstrate how the tool works on BioTuring's platform.
BioTuring
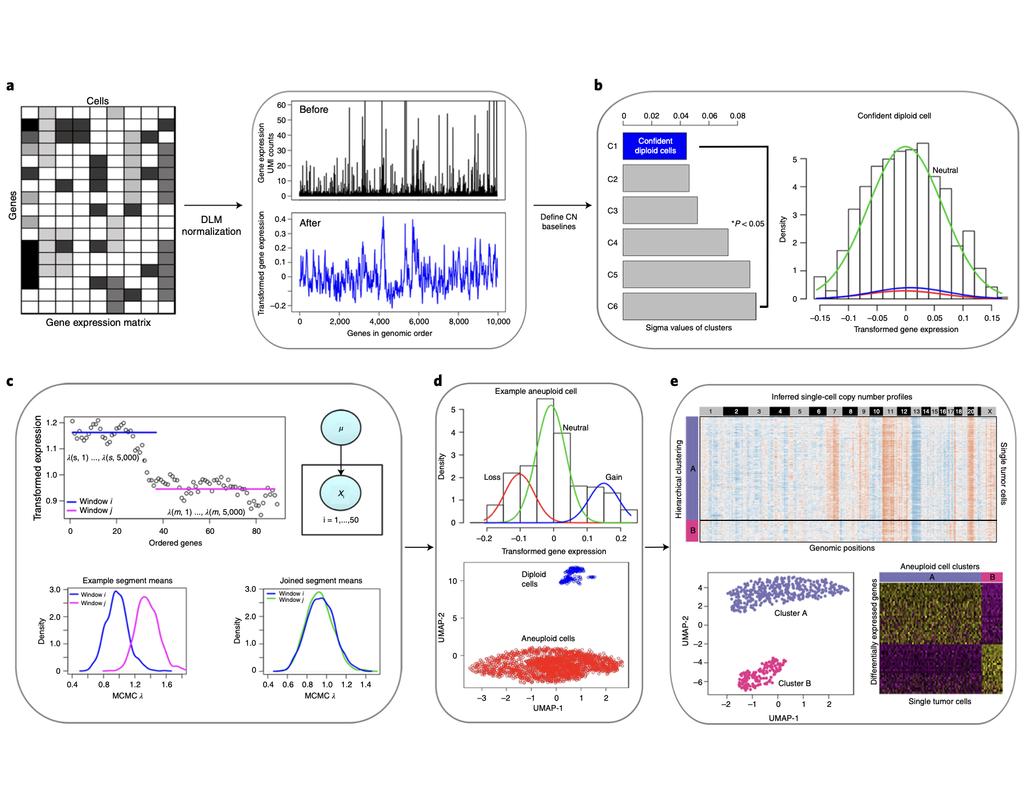
Classification of tumor and normal cells in the tumor microenvironment from scRNA-seq data is an ongoing challenge in human cancer study.
Copy number karyotyping of aneuploid tumors (***copyKAT***) (Gao, Ruli, et al., 2021) is a method proposed for identifying copy number variations in single-cell transcriptomics data. It is used to predict aneuploid tumor cells and delineate the clonal substructure of different subpopulations that coexist within the tumor mass.
In this notebook, we will illustrate a basic workflow of CopyKAT based on the tutorial provided on CopyKAT's repository. We will use a dataset of triple negative cancer tumors sequenced by 10X Chromium 3'-scRNAseq (GSM4476486) as an example. The dataset contains 20,990 features across 1,097 cells. We have modified the notebook to demonstrate how the tool works on BioTuring's platform.

BioTuring
The development of large-scale single-cell atlases has allowed describing cell states in a more detailed manner. Meanwhile, current deep leanring methods enable rapid analysis of newly generated query datasets by mapping them into reference atlases.
expiMap (‘explainable programmable mapper’) Lotfollahi, Mohammad, et al. is one of the methods proposed for single-cell reference mapping. Furthermore, it incorporates prior knowledge from gene sets databases or users to analyze query data in the context of known gene programs (GPs).
Trends
BioTuring
Dampened weighted least squares (DWLS) is an estimation method for gene expression deconvolution, in which the cell-type composition of a bulk RNA-seq data set is computationally inferred. This method corrects common biases towards cell types that are characterized by highly expressed genes and/or are highly prevalent, to provide accurate detection across diverse cell types.
To begin, the user must input a bulk RNA-seq data set, along with a labeled representative single-cell RNA-seq data set that will serve to generate cell-type-specific gene expression profiles. Ideally, the single-cell data set will contain cells from all cell types that may be found in the bulk data. DWLS will return the cell-type composition of the bulk data.