


Notebooks

Categories


Cells
Premium

BioTuring
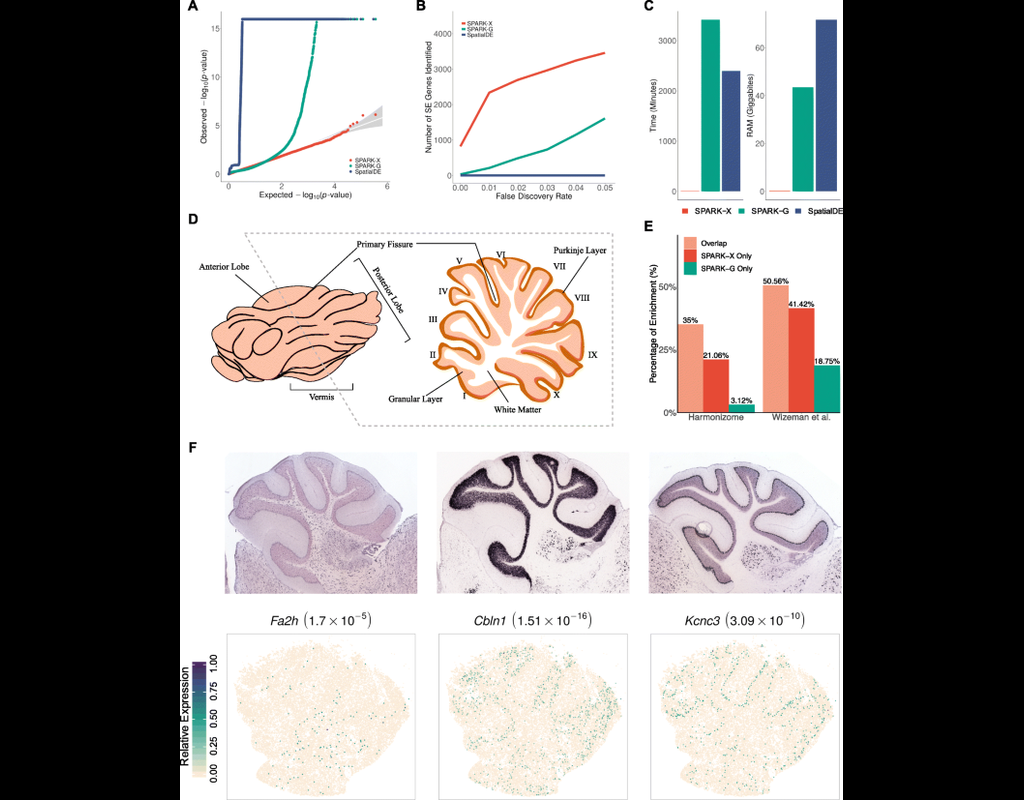
Spatial transcriptomic studies are becoming increasingly common and large, posing important statistical and computational challenges for many analytic tasks. Here, we present SPARK-X, a non-parametric method for rapid and effective detection of spatially expressed genes in large spatial transcriptomic studies.
SPARK-X not only produces effective type I error control and high power but also brings orders of magnitude computational savings. We apply SPARK-X to analyze three large datasets, one of which is only analyzable by SPARK-X. In these data, SPARK-X identifies many spatially expressed genes including those that are spatially expressed within the same cell type, revealing new biological insights.
BioTuring
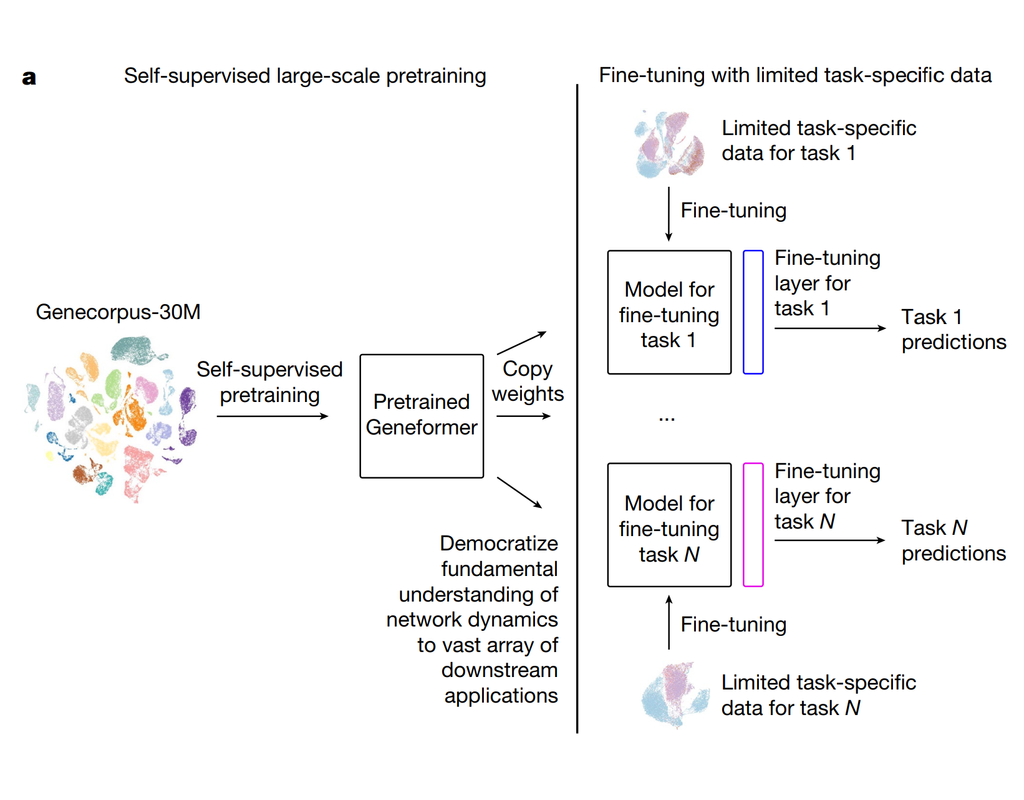
Geneformer is a foundation transformer model pretrained on a large-scale corpus of ~30 million single cell transcriptomes to enable context-aware predictions in settings with limited data in network biology. Here, we will demonstrate a basic workflow to work with ***Geneformer*** models.
These notebooks include the instruction to:
1. Prepare input datasets
2. Finetune Geneformer model to perform specific task
3. Using finetuning models for cell classification and gene classification application

BioTuring
Computational methods that model how the gene expression of a cell is influenced by interacting cells are lacking.
We present NicheNet, a method that predicts ligand–target links between interacting cells by combining their expression data with prior knowledge of signaling and gene regulatory networks.
We applied NicheNet to the tumor and immune cell microenvironment data and demonstrated that NicheNet can infer active ligands and their gene regulatory effects on interacting cells.

BioTuring
Spatially resolved gene expression profiles are key to understand tissue organization and function. However, spatial transcriptomics (ST) profiling techniques lack single-cell resolution and require a combination with single-cell RNA sequencing (scRNA-seq) information to deconvolute the spatially indexed datasets.
Leveraging the strengths of both data types, we developed SPOTlight, a computational tool that enables the integration of ST with scRNA-seq data to infer the location of cell types and states within a complex tissue. SPOTlight is centered around a seeded non-negative matrix factorization (NMF) regression, initialized using cell-type marker genes and non-negative least squares (NNLS) to subsequently deconvolute ST capture locations (spots).
Simulating varying reference quantities and qualities, we confirmed high prediction accuracy also with shallowly sequenced or small-sized scRNA-seq reference datasets. SPOTlight deconvolution of the mouse brain correctly mapped subtle neuronal cell states of the cortical layers and the defined architecture of the hippocampus. In human pancreatic cancer, we successfully segmented patient sections and further fine-mapped normal and neoplastic cell states.
Trained on an external single-cell pancreatic tumor references, we further charted the localization of clinical-relevant and tumor-specific immune cell states, an illustrative example of its flexible application spectrum and future potential in digital pathology.
Trends
BioTuring
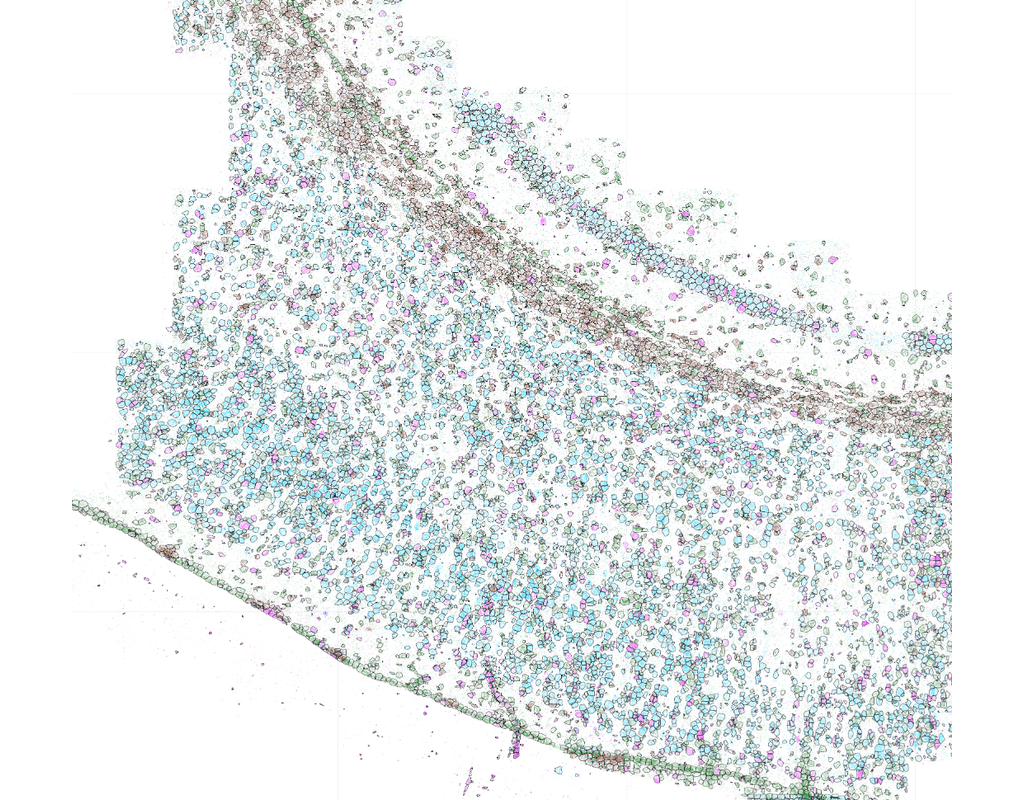
Single-molecule spatial transcriptomics protocols based on in situ sequencing or multiplexed RNA fluorescent hybridization can reveal detailed tissue organization. However, distinguishing the boundaries of individual cells in such data is challenging and can hamper downstream analysis.
Baysor is a tool for performing cell segmentation on imaging-based spatial transcriptomics data. It optimizes two-dimensional (2D) or three-dimensional (3D) cell boundaries segmentation considering the likelihood of transcriptional composition, size and shape of the cell (cell morphology). The approach can take into account nuclear or cytoplasm staining, however, can also perform segmentation based on the detected molecules alone.